Avalanche (AVAX) Technical Analysis – What’s Next?
Avalanche (AVAX) has been moving sideways after a strong summer rally, with price action hinting at the next major move. Let’s dive into the current setup.
📊 Chart Overview
On the daily chart (AVAX/USDT):
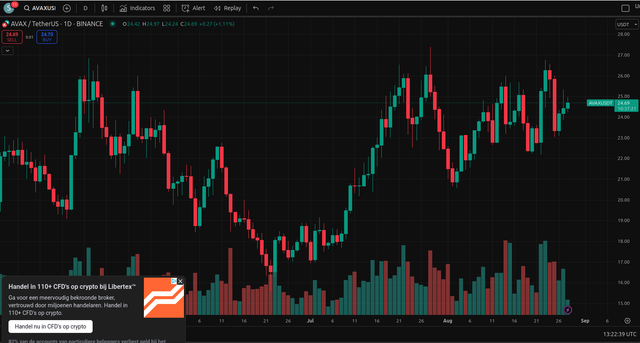
- Recovery from July Lows: AVAX bottomed near $18 in late June before entering a strong uptrend, pushing prices back to $27 in mid-August.
- Range-Bound Trading: Since then, the price has been fluctuating between $23 – $26, building a sideways consolidation channel.
- Support Holding: Buyers have defended the $23 – $24 zone multiple times, showing strong demand at this level.
- Resistance Cap: On the upside, $26 – $27 remains the key resistance zone, where sellers step in to take profit.
🔑 Key Levels
- Immediate Support: $23.50 – $24.00
- Major Support: $22.00 (if the range breaks down)
- Immediate Resistance: $25.50 – $26.00
- Major Resistance: $27.00
A break above $27 could trigger a run toward $30 – $32, while losing $23 would likely send AVAX back to $21 – $22.
🚀 Momentum Check
- Volume has decreased compared to the July rally, suggesting traders are waiting for a breakout before committing big capital.
- Price action shows higher lows since June, which is a bullish sign as long as $23 holds.
📈 Outlook – Where Is AVAX Going?
- Bullish Case: If AVAX can reclaim $26 and close above $27, momentum could push toward the $30+ zone in September.
- Neutral Case: Continued sideways trading between $23 – $26 as the market consolidates before the next move.
- Bearish Case: A break below $23 would invalidate the bullish structure and may drag price back to $21 or even $20.
👉 In summary: AVAX is in a make-or-break zone. As long as it holds above $23, the path of least resistance looks upward, with $27 as the key breakout level to watch.
