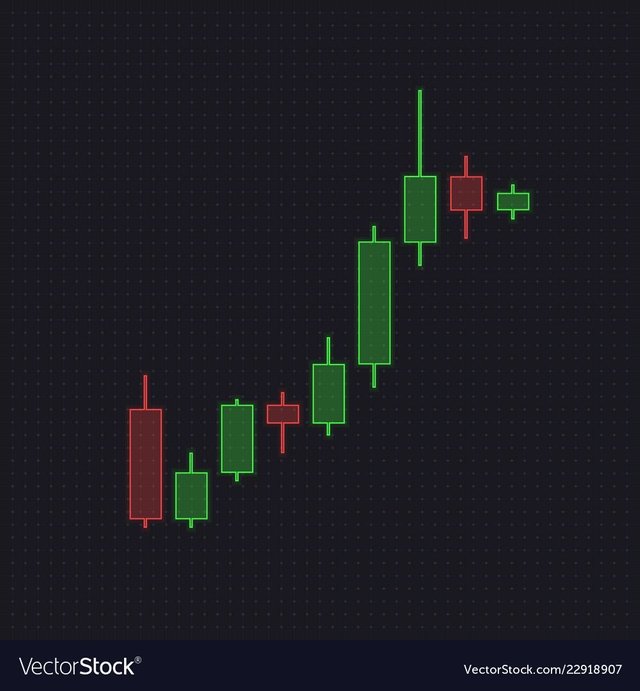
📊 Did You Know There’s a Powerful Candle on the Monthly Chart?
In the world of technical analysis, candlestick patterns on higher timeframes — such as the monthly chart — are considered some of the most reliable signals that traders and investors use in their decision-making process.
🕯️ Recently, a significant candlestick pattern has appeared on the monthly chart — one of the strongest types, with a historical success rate exceeding 90%.
This candle doesn’t appear often, but when it does, it usually indicates a strong trend reversal or confirmation of an ongoing trend, especially after a period of consolidation or prolonged decline.
⸻
🔍 What Does This Candle Mean for the Near Future?
• If you’re a long-term investor, this could be your golden opportunity.
• If you’re a short-term trader, it might be time to reassess your current strategy.
⸻
⚠️ Note:
A 90% success rate doesn’t guarantee an outcome — markets are influenced by many variables. However, a candle of this strength on the monthly chart is always worth paying close attention to.
