$VADER Technical Analysis – Virtuals Ecosystem AI Agent Token
$VADER, part of the Virtuals ecosystem and running AI agents on Base, has been on quite a rollercoaster ride in 2025. Let’s break down the recent price action and potential scenarios ahead.
Price Overview
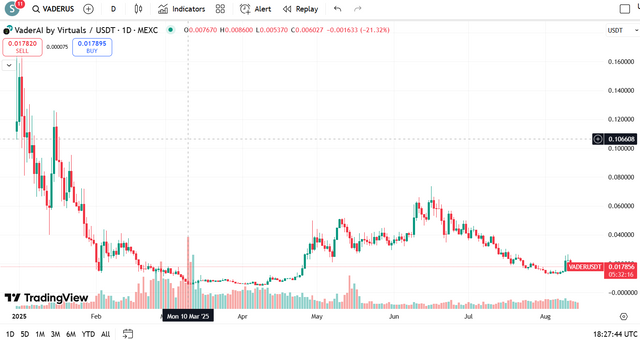
- Current Price: $0.01785 USDT
- 24h Change: +~21% (after a sharp bounce from recent lows)
- Exchange: MEXC
- Timeframe: Daily chart
Historical Price Movement
- January – March 2025: Strong initial interest post-listing, but heavy sell pressure pushed the token from above $0.16 to under $0.01.
- April – June 2025: Extended accumulation phase around $0.01–$0.02, followed by a powerful breakout in May, reaching ~$0.08 in June.
- June – Early August 2025: Gradual decline with consistent lower highs and lower lows, returning to the $0.017–$0.02 zone.
- Mid-August 2025: Sudden spike in both price and volume, indicating renewed interest and potential trend shift.
Technical Levels
Support Zones:
- $0.0060 – $0.0070: Recent bounce area, strong short-term support.
- $0.0150 – $0.0170: Current consolidation zone, acting as immediate support.
Resistance Levels:
- $0.0300: First major resistance from late July.
- $0.0600 – $0.0650: Strong resistance from June highs.
- $0.10+: Psychological and historical resistance from early-year peak.
Volume & Momentum
- Volume has significantly increased on the recent bounce, suggesting new buyers are entering.
- Momentum indicators (RSI, MACD) likely turning bullish after a prolonged oversold phase (confirmation needed from next few candles).
Potential Scenarios
Bullish Case:
If buying pressure sustains above $0.017, we could see a retest of $0.03 in the short term. A breakout here might target $0.06+.
Bearish Case:
Failure to hold $0.017 could see a pullback toward $0.010 or even the $0.006 support zone.
Outlook
Given its role in the Virtuals AI ecosystem—powering AI agents on Base—$VADER has strong narrative potential. This recent price spike could mark the end of the downtrend, but confirmation requires holding above current levels and breaking early resistances.
Short-term traders will watch for volume continuation and momentum breakout. Long-term holders may see this as an accumulation zone if fundamentals remain strong.
This is not financial advice. Always do your own research before making investment decisions.

Upvoted! Thank you for supporting witness @jswit.