Cryptocurrency and ICO Market Analysis (September 16-23, 2018)
This report presents data on cryptocurrency and ICO market changes during 2018. Special emphasis has been placed on an analysis of the changes that have taken place during September 2018, including over the period (September 16-23, 2018).
Information as of September 24, 2018
Professor Dmitrii Kornilov, Doctor of Economics, Member of the Russian Academy of Natural Sciences, and Leading Analyst at ICOBox
Dima Zaitsev, PhD in Economics, Head of International Public Relations and Business Analytics Department Chief at ICOBox
Nick Evdokimov , Co-Founder of ICOBox
Mike Raitsyn , Co-Founder of ICOBox
Anar Babaev , Co-Founder of ICOBox
Daria Generalova, Co-Founder of ICOBox
Cryptocurrency Market Analysis (September 16-23, 2018)
1. General cryptocurrency and digital assets market analysis. Market trends
1.1. General cryptocurrency and digital assets market analysis
1. General cryptocurrency and digital assets market analysis. Market trends
1.1. General cryptocurrency and digital assets market analysis
Table 1.1. Trends in capitalization of the cryptocurrency market and main cryptocurrencies from July 1, 2018 to September 23, 2018
Cryptocurrency market capitalization increased over the analyzed period (September 16-23, 2018), and as of 03:00 UTC equaled $224.4 billion (see Table 1.1). In this regard, bitcoin dominance fell from 55.5% to 51.7%. Lately this correspondence has been characteristic: bitcoin dominance increases during a prolonged fall in capitalization, and during a market recovery and a growth in capitalization the opposite occurs. The market dominance of the four and eight largest cryptocurrencies as of 03:00 UTC on September 23, 2018, equaled 76.7% and 83.6%, respectively (see Table 1.1).
The drop in cryptocurrency market capitalization compared to the start of the month equaled around $4.1 billion, including a drop in bitcoin capitalization by $5.5 billion, while altcoin dominance, on the contrary, increased by $1.4 billion. This shows once again that altcoins are much more volatile and sensitive to changes in the mood of the cryptocurrency market. During periods of market growth, their price and capitalization generally increase faster, and during market downswings they lose value quicker.
During the period from September 16-23, 2018, cryptocurrency market capitalization fluctuated from $191.6 billion (min) to $227.5 billion (max) (Fig. 1a), i.e. within a range of $36.1 billion. For its part, bitcoin capitalization fluctuated from $107 billion (min) to $117.7 billion (max), i.e. within a range of $10.2 billion.
Figure 1a. Cryptocurrency market capitalization since September 16, 2018
Figure 1b shows the change in bitcoin capitalization over the week.
The factors that influenced the sharp fluctuations in cryptocurrency market capitalization and the bitcoin price on September 18-20 are:
On September 18 a message appeared in the Twitter account of the Bitcoin Core Project on the update of Bitcoin Core (version 0.16.3), which eliminated a critical vulnerability for the bitcoin network. The bug was first found in the version Bitcoin Core 0.14.0 in November 2016 and could have disrupted the work of nearly 90% of nodes, with miners only needing 12.5 BTC to carry out an attack.
On September 19 the developer of the LBRY platform took to Twitter to announce the hack of the Japanese Zaif exchange and the theft of 5,966 BTC (USD 37 million) from a hot wallet (the theft happened five days ago, but, according to the developer, it took the exchange four days to discover the hack). BCH and MONA were also stolen. The total damage is estimated at $60 million. Cryptocurrency market capitalization dropped, with the bitcoin price plunging to $6,226, before then quickly climbing back to $6,446. This growth may have been caused by the purchase on the BitMEX 5 exchange of five million futures contracts at $6,469.20.
On September 20 the US Securities and Exchange Commission (SEC) published information on the start of public consideration of the bitcoin ETF applications of the New York-based companies VanEck and SolidX, which will result in a decision either to approve or disapprove them. Right now one can find numerous comments from individuals and legal entities on the SEC’s website.
On September 21 the bitcoin price increased by approximately $400 over the course of the day, from $6,400 to $6,800, and the 24-hour trading volume (Volume 24h) of the entire cryptocurrency market doubled from $11.3 billion to $21.2 billion, including on the back of Ripple, the price of which jumped from $0.4 to $0.69, i.e. by more than 70%, during the day.
This revitalization of the cryptocurrency market can be tied to three events:
first the market received the news (which appeared in the media mainly on September 21) that the SEC had required more information to take a decision on bitcoin ETFs as good news, but later in the week many gradually began to perceive this as the drawing out of the examination process, meaning that the new instrument will almost certainly not appear on the market by the end of the year;
on September 21 the cryptocurrency Ripple, buoyed by numerous positive news items and events, surpassed Ethereum for a short time and took over second place among cryptocurrencies by capitalization according to the data of coinmarketcap:
-Ripple is preparing the full-scale launch of xRapid based on XRP.
-The American banking giant PNC has joined the growing number of financial institutions using blockchain-based
payment products of the Ripple startup.
-CCN announced that the Japanese financial services group SBI Holdings is planning to introduce the MoneyTap payment
app for clients on Android and iOS, using blockchain technology from Ripple.
-Before September 10 a message appeared on the BUSINESS WIRE website that the R3 blockchain consortium had
withdrawn its court claims, and at the start of the month the British project TransferGo had started to use Ripple to
perform money transfers in real time with banking partners in India.
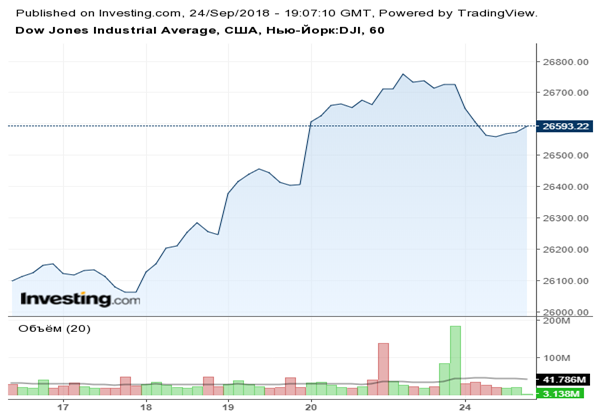
As a result, the Ripple price grew by more than 100% over the week.The Dow Jones industrial average increased on September 21, reaching an all-time high for the second day in a row.
The rise and fall of cryptocurrency prices over the past seven days (September 16-23, 2018)
Last week’s leaders from among the top 500 cryptocurrencies by capitalization that showed the growth of more than 100% were the projects Carebit (+3,730.83%), Vezt (+248.12%), Electroneum (+148.19%), XRP (+107.76%), and Crown (+105.34%). However, it should be noted that the sharp increase in the price of Carebit and Vezt took place at low trading volumes. The growth of NavCoin (+87.43%) and VIBE (+87.15%) should also be noted. This is the second week that VIBE has been among the growth leaders from among the top 500, despite the strong volatility of its price (VIBE’s growth during the week from September 9-16 equaled +105.55%). The main favorable news for the VIBE price this week was the news on the launch of the project’s main network on September 23.
During the period from September 16-23, 2018, the change in the prices of cryptocurrencies in the top 500 ranged from -55.85% (BitcoinDark) to +3,730.83% (Carebit). The Carebit token is only traded on three small cryptoexchanges, and has a very small 24-hour trading volume, possibly because the project was abandoned by its developers (with no new messages appearing on its official Twitter account since May). Due to this fact, it is very easy to influence the price of this token, and all changes in the price are speculative in nature. For example, we see an abrupt drop in the price by the end of the day on September 23, after a growth of more than 3,000% a day earlier.
Like Carebit, BitcoinDark was abandoned by its developers. The creators of BitcoinDark are currently working on the Komodo (KMD) project. Holders of BitcoinDark were given the right to exchange the tokens for KMD until mid-January 2018. However, there are still currently 1,288.862 BTCD in circulation. The trading volume of BitcoinDark is not large, and only take place on the Poloniex exchange, and therefore this token is susceptible to the actions of profiteers.
The price of 357 cryptocurrencies and digital assets from the top 500 showed growth, including 83 from the top 100.
Over the past week the number of cryptocurrencies with a capitalization of more than $1 billion increased from 15 to 17 (having been joined by Binance Coin and Tezos), with the price of all of them increasing except Tether (the price of which is tied to the US dollar).
The coins and tokens from the top 100 that demonstrated the largest price growth are given in Fig. 2.
Biggest gainers and losers over the week (September 16-23, 2018)
The prices of some cryptocurrencies may fluctuate from -50% to +50% over the course of a single day. Therefore, when analyzing cryptocurrency price trends, it is advisable to use their average daily amounts on various cryptoexchanges.
Below we consider the 10 cryptocurrencies that demonstrated the most significant change in price over the past week (Fig. 2-3). In this regard, only those coins and tokens included in the top 100 (Fig. 2, Fig. 3) by market capitalization were considered2.


Figure 2. Largest growth in prices over the past week
Tables 1.2 and 1.3 show the possible factors or events that might have influenced the fluctuation in prices for certain cryptocurrencies. Table 1.4 shows the possible factors or events that might have influenced the cryptocurrency market in general.
Table 1.2. Factors or events that might have led to a growth in cryptocurrency prices over the past week

A depreciation in price was seen last week for 143 coins and tokens from the top 500 cryptocurrencies and digital assets by capitalization. The ten crypto assets from the top 100 that experienced the most noticeable drops in price are shown in Fig. 3 and Table 1.3.

Figure 3. Largest fall in prices over the past week
Table 1.3. Factors or events that might have led to a fall in cryptocurrency prices over the past week

Table 1.4 shows events that took place from September 17-23, 2018, that had an impact on both the prices of the dominant cryptocurrencies and the market in general, with an indication of their nature and type of impact.
Table 1.4. Key events of the week having an influence on cryptocurrency prices, September 17-23, 2018

To analyze trading activity on cryptocurrency exchanges, the ZAK-n Crypto index is calculated (see the Glossary). The values of the ZAK-4 Crypto and ZAK-8 Crypto indices are presented in Tables 1.1, 1.5.a, and 1.5.b. In September the 24-hour trading volumes (Volume 24h) for the four dominant cryptocurrencies (Bitcoin, Ethereum, Bitcoin Cash, Ripple) equaled from $5.3 billion to $14.1 billion (Table 1.5.a). The value of the daily ZAK-4 Crypto ranged from 3.4% to 8.7% of capitalization. The highest trading volume was seen on September 21. The main reason for this activity was Ripple, the 24-hour trading volume of which increased sharply from $0.2 to $4.1 billion.
Table 1.5.a. Daily ZAK-4 Crypto index calculation (from September 1-23, 2018)


By the end of last week the 24-hour trading volumes (Volume 24h) for the eight dominant cryptocurrencies not including Tether (Bitcoin, Ethereum, Bitcoin Cash, Ripple, Litecoin, Stellar, EOS, and Cardano) equaled $8.8 billion (Table 1.5.b), or 4.7% of their market capitalization. The ZAK-4 Crypto and ZAK-8 Crypto indices are considered in more detail in Tables 1.5.a and 1.5.b.
Table 1.5.b. Daily ZAK-8 Crypto index calculation (continuation of Table 1.5.а)


Table 1.6 gives a list of events, information on which appeared last week, which could impact both the prices of specific cryptocurrencies and the market in general.
Table 1.6. Events that could have an influence on cryptocurrency prices in the future

1.2. Market trends
The weekly cryptocurrency and digital asset market trends from December 31, 2017, to September 23, 2018, are presented as graphs (Fig. 1.1-1.5).
Table 1.7. Legends and descriptions of the graphs

Figure 1.1. Total cryptocurrency market capitalization
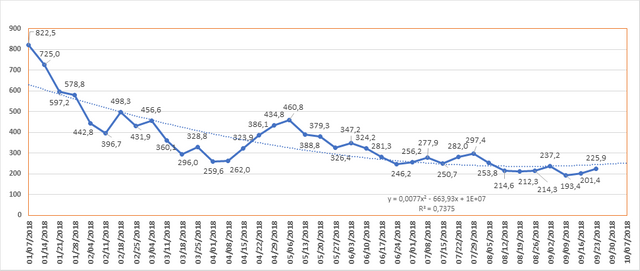
Figure 1.1 shows a graph of the weekly cryptocurrency market change from December 31, 2017, to September 23, 2018. Over this period, market capitalization dropped from $572.5 billion to $225.9 billion, i.e. by 61%. Last week (September 16-23, 2018) cryptocurrency market capitalization increased from $201.4 billion to $225.9 billion (as of September 23, 2018, based on the average daily figures from coinmarketcap.com).

Figure 1.2. Change in market capitalization
The market is susceptible to sudden and drastic fluctuations. Nine of the thirteen weeks in the first quarter of 2018 were “in the red,” i.e. capitalization fell based on the results of each of these weeks, and the weekly fluctuations ranged from USD -136 billion to USD +250 billion.
Six of the thirteen weeks in the second quarter were “in the red.” The market grew based on the results of the other seven weeks. As noted earlier, a growth was seen in April, while in May and June there was generally a reduction in capitalization. The weekly fluctuations ranged from USD -72 billion to USD +62.2 billion.
In the third quarter seven of the 12 weeks have seen an increase in capitalization, and five a decrease (with due account of average daily data of coinmarketcap.com, see Fig. 1.2). In July there was an increase of $20 billion, but August saw a decrease of $49 billion. On the whole, since early September capitalization has fallen by approximately $4.1 billion.


Figure 1.3. Number of cryptocurrencies and digital assets
Since December 31, 2017, the total number of cryptocurrencies and digital assets presented on coinmarketcap has increased from 1,335 to 1,988. However, when calculating cryptocurrency market capitalization only those coins and tokens on which there is information on trades (trading volume) are taken into consideration. Over the past week their number increased from 1,839 to 1,902, while average capitalization grew to $118.8 million. In total, over the past month 105 new coins and tokens have appeared on coinmarketcap.com. However, it should be noted that a number of other coins and tokens were also excluded from the list. Among the tokens that were added to coinmarketcap.com last week, Eden, Formosa Financial and Concierge Coin showed high trading volumes.


Figures 1.4 and 1.5. Forecast of total cryptocurrency market capitalization
- Without question, the stock market and cryptocurrency market, as two financial mechanisms, influence one another, although the scale of the cryptocurrency market is much smaller. According to many expert assessments, the connection is direct, a fact that is confirmed by:
-the results of the in-depth analysis (Virtual Currencies and the Central Bank’s Monetary Policy: Challenges Ahead) provided by the European Parliament. According to this report, the crypto industry has had a positive effect on global transactions.
-and the changes in key indices. In particular, the corresponding changes in the Dow Jones Industrial Average (DJIA) and the bitcoin price at the beginning of the year allow us to talk of the existence of a certain relationship.
We remind you that during trading on February 5, 2018, the Dow Jones Industrial Average fell by almost 1,200 points, a largest one-day drop in history. Of course, the cryptocurrency market is much more volatile than the stock market. For example, from January 30 to February 12 the bitcoin price decreased by 24.12%, while the DJIA fell by 7.39%. However, such a fall is very significant for the stock market.
The drop in the Dow Jones index was most notable on February 5-6, 2018, which is attributed to possibility of a growth in the key interest rate. On February 2, 2018, the US Department of Labor issued statistics on employment and wages that exceeded expectations. The published data could attest to an increase in consumer spending and have an effect on inflation. In this case, to counteract possible inflation the American Federal Reserve System would be forced to raise interest rates. The risk of an increase in interest rates is enough to seriously impact the behavior of investors, who in such cases usually try to lock in their profits.
Last Friday, September 21, the Dow Jones Industrial Average increased, reaching an all-time high for the second day in a row.
As we watched, the cryptocurrency market and market capitalization jumped over the course of one day by nearly $25 billion on September 21.
- Now investors are awaiting a meeting of the American bank regulator, which is scheduled for September 25-26. Most analysts forecast an increase in rates at the upcoming meeting to 2-2.25%, from the current level of 1.75-2%. The regulator is also expected to reveal information on the growth of interest rates in 2020 and 2021. At the same time, China has announced that it will introduce symmetrical increases in import duties on more than 5.2 thousand American goods worth $60 billion starting from September 24 in response to the new duties imposed by the USA.
In any case, one can anticipate heightened activity on both stock markets and the cryptocurrency market on September 25-26.
ICO Market Analysis (September 17-23, 2018)
1. General analysis of the ICO market (by week, month)
1.1. Brief overview of ICO market trends
1. General analysis of the ICO market (by week, month)
1.1. Brief overview of ICO market trends
Table 1.1. Brief ICO market overview, key events, news for the past week (September 17-23, 2018)

Table 1.2 shows the development trends on the ICO market since the start of May 2018. Only popular and/or successfully completed ICOs (i.e. ICOs which managed to collect the minimum declared amount of funds) and/or ICOs listed on exchanges were considered.
Table 1.2. Aggregated trends and performance indicators of past (completed) ICOs1,2,3

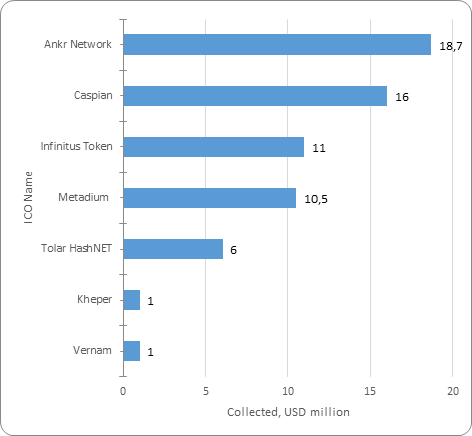
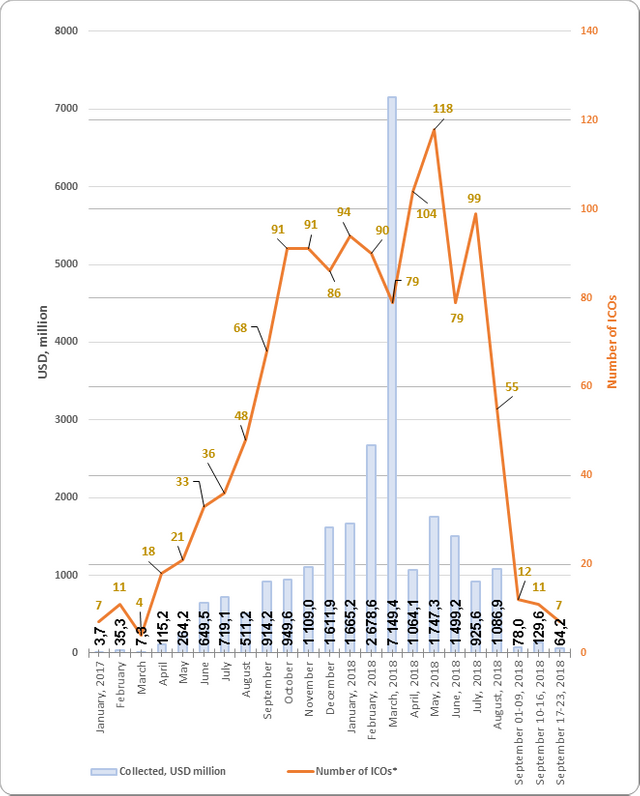
The data for the previous period have been adjusted to account for the appearance of more complete information on past ICOs. Over the previous period (September 17-23, 2018) the amount of funds collected via ICOs equaled $64.2 million. This amount consists of the results of 7 ICOs that disclosed their data, with the largest amount of funds collected equaling $18.7 million by the Ankr Network ICO. The average collected funds per ICO project equaled $9.2 million (see Tables 1.2, 1.3). A total of more than 30 ICOs were completed last week. However, not all projects indicate the amount of funds collected on their official websites (Table 1.5).
Table 1.3. Amount of funds collected and number of ICOs


Table 1.3 shows that the largest amount of funds was collected via ICOs in March 2018, mainly due to the appearance of major ICOs. The highest average collected funds per ICO was also seen in March 2018.
Figure 1.1. Trends in funds collected and number of ICOs since the start of 2017
1.2. Top ICOs since the start of the month
Table 1.4. Top 7 ICOs by the amount of funds collected (September 17-23, 2018)


The data for the previous period (September 17-23, 2018) may be adjusted as information on the amounts of funds collected by completed ICOs is finalized.
Last week’s leader was the Ankr Network project, which aims to create a blockchain platform in the area of cloud computing. The project will give participants incentives to introduce their computing resources into the network to reduce the cost and improve the efficiency of computing operations. All the transaction fees in subsidiary chains will be paid exclusively in network tokens, and users will be able to earn them by providing their computing capacity. This solution is expected to be less expensive than centralized solutions such as Amazon or Google cloud services. It is similar to the projects Golem (market capitalization of $136 million) and SONM (market capitalization of $20 million).
Figure 1.2 shows the top 7 ICOs.

Figure 1.2. Top 7 ICOs by the amount of funds collected (September 17-23, 2018)
During the analyzed period (September 17-23, 2018) more than 30 ICO projects were completed, and at least 7 projects have clearly indicated the amount of funds collected on their websites and this amount exceeds $100,000. The total amount of funds collected equaled around $64 million. Last week’s leader was the Ankr Network project, which collected $18.7 million. The total amount of funds collected by a number of ICOs failed to reach even $100,000 (the information for some projects is still being finalized).
The Glossary is given in the Annex.


