Steem blockchain inflation review for Q3/2025: A new peak in daily production, and maybe the last echoes of Q1's inflation tsunami
Overview
As-in Q1 and Q2, 2025, the long term inflation rate is highly elevated again, now for the 3rd consecutive quarter as a result of the February Upbit delisting of SBDs. Using all available data from here, the APR has been 14.08%. As with Q2, nearly all of the increase was in February and March, though. It looks like most of the inflation will probably drop off the chart in Q4, but that remains to be seen.
The 90-day inflation rate is 8.35%, and at 6.31%, the 30-day inflation rate seems to have leveled off, but remains slightly elevated from the blockchain's base rate of 5.82% as a result of ongoing SBD to STEEM conversion activity.
In terms of New STEEM per day, however the story has changed from Q2. It appears that we hit a new local peak of 93,294 STEEM per day on July 26 and the current rate has declined to 93,184 STEEM per day as-of September 25.
So let's move on to the details.
1. Here's what would be expected for the next few months, based on current values (subject to change from known and unknown factors):
| Date | Block # | Inflation Rate | Supply | New Steem Per Day | Haircut Supply | Haircut Steem Per Day | Lower Bound Supply | Lower Bound Steem Per Day |
|---|---|---|---|---|---|---|---|---|
| 2025-09-28 11:46:59.088029 | 99500000 | 0.058000 | 586348040 | 93173 | 586348071 | 93173 | 527713264 | 83855 |
| 2025-10-07 04:06:59.088029 | 99750000 | 0.057900 | 587156694 | 93140 | 587156725 | 93140 | 528441053 | 83826 |
| 2025-10-15 20:26:59.088029 | 100000000 | 0.057800 | 587965065 | 93107 | 587965097 | 93107 | 529168587 | 83797 |
| 2025-10-24 12:46:59.088029 | 100250000 | 0.057700 | 588773149 | 93074 | 588773180 | 93074 | 529895862 | 83767 |
| 2025-11-02 05:06:59.088029 | 100500000 | 0.057600 | 589580941 | 93040 | 589580973 | 93040 | 530622875 | 83736 |
| 2025-11-10 21:26:59.088029 | 100750000 | 0.057500 | 590388438 | 93006 | 590388469 | 93006 | 531349622 | 83705 |
| 2025-11-19 13:46:59.088029 | 101000000 | 0.057400 | 591195634 | 92971 | 591195666 | 92971 | 532076099 | 83674 |
| 2025-11-28 06:06:59.088029 | 101250000 | 0.057300 | 592002526 | 92936 | 592002558 | 92936 | 532802302 | 83642 |
| 2025-12-06 22:26:59.088029 | 101500000 | 0.057200 | 592809110 | 92900 | 592809142 | 92900 | 533528228 | 83610 |
So, our forward-looking daily production rate of 93,173 would be down by about 1/10% from the July peak of 93,294 STEEM per day. All else being equal, we would expect that value to continue dropping as time passes. By December, it would be down to 92,900, which is about 0.4% below the July peak.
2. And here's what the full visualizations of expected new STEEM per day look like (also subject to change from known and unknown factors):
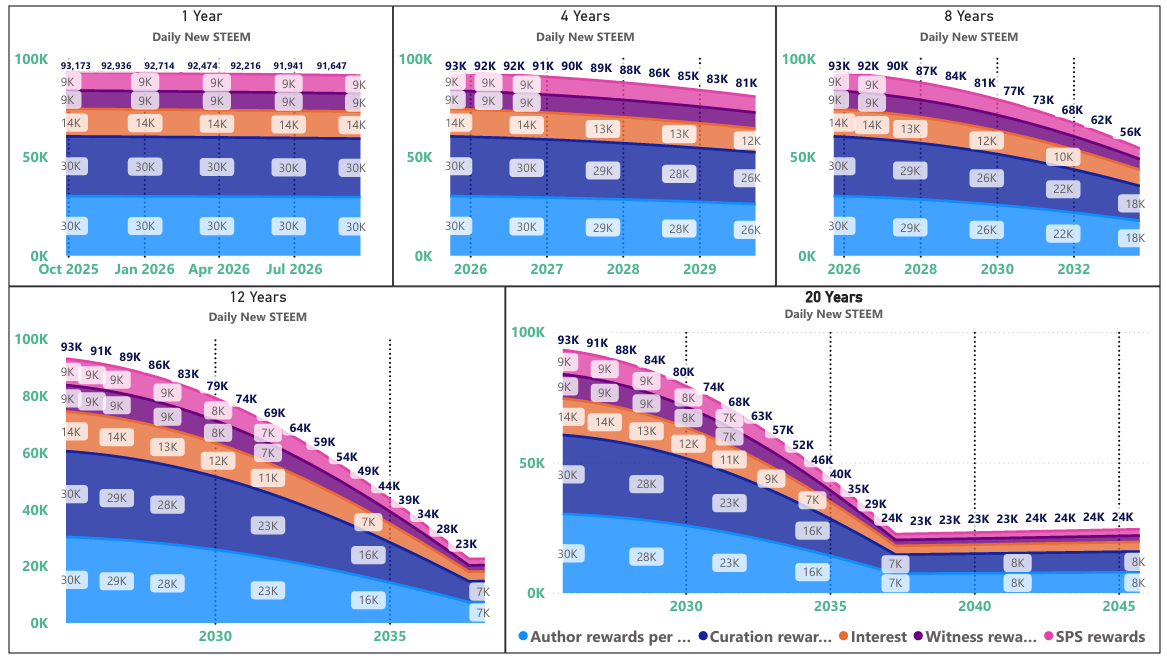
This would put us at the December, 2024 level (88,823 STEEM per day) again in September, 2027, and it would put us at the November, 2023 peak (89,913) in May, 2027. So, it looks like the overall time cost from the Upbit delisting and subsequent conversion activity is now estimated at about 3 1/2 years.
One thing interesting in the visual is that I think this is the first quarter where the downslope has been easily visible the 1-year time scale, so the impact of the blockchain's declining inflation rate is definitely starting to take hold.
3. Here's a forward looking visual with projections for daily new STEEM, expected virtual supply, and the blockchain inflation rate with upper and lower values, depending upon the price of STEEM in comparison to the haircut ratio.
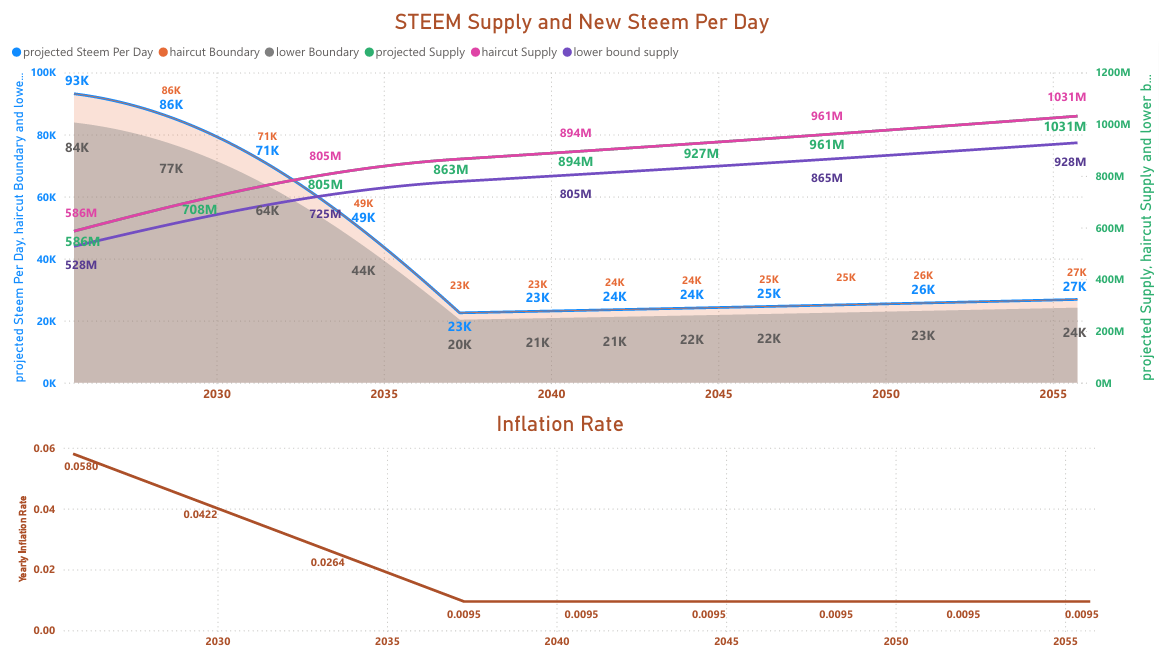
The price of STEEM remains below the haircut price, so the most efficient way to reduce inflation is to raise the price of STEEM substantially above that threshold. I haven't verified this, but I believe this has probably been true for most of Steem's lifetime. Not sure, but my gut feeling is that STEEM's price has spent a fairly high percentage of its history below the haircut threshold. Of course, reducing SBD conversions and burning tokens can help a little bit when STEEM's price is below the threshold.
4. Now let's look backwards in time using data from SteemDB
4.1 Q2/2025 (90-days trailing)
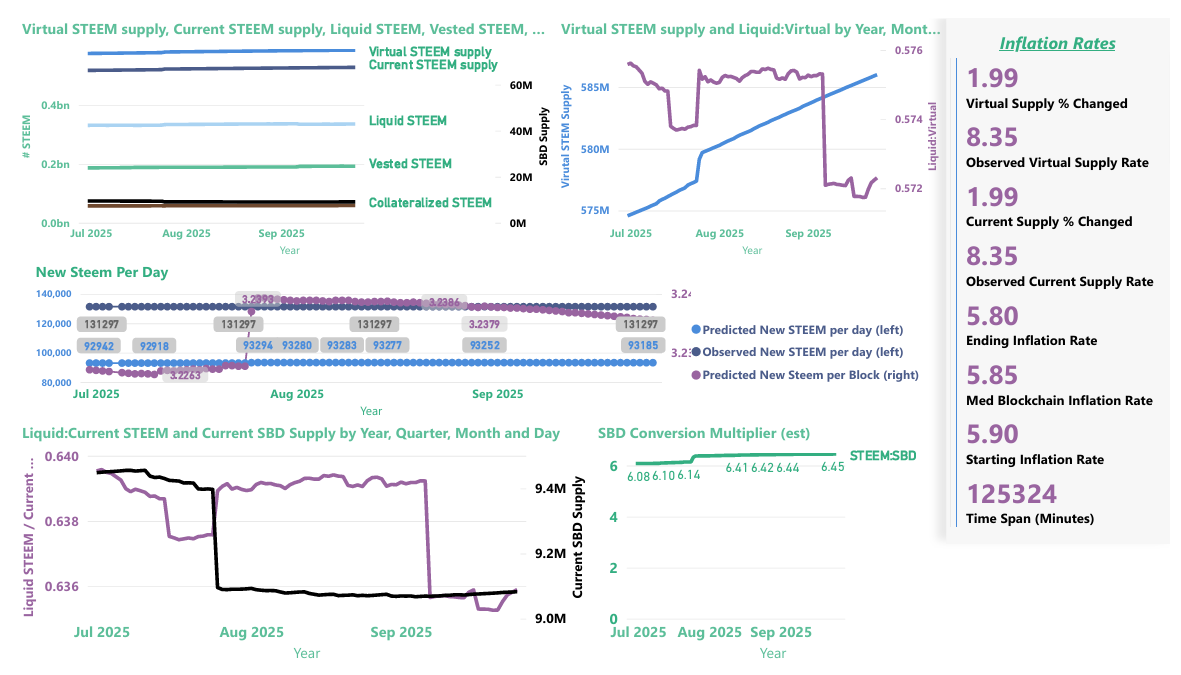
So, the blockchain's core inflation ranged from 5.8 to 5.9%, with a median of 5.85%. The observed inflation, after including other factors was 8.35%. The main factor driving the difference between the blockchain's rate and the observed rate was the increase in STEEM/SBD from 6.08 to 6.45. This increases the "collateralized STEEM" portion of the virtual supply - i.e. the number of STEEM that are owed by the blockchain to SBD holders. The increasing STEEM/SBD ratio is driven by SBD conversions, which act to lower the haircut price.
Focusing on the "New Steem Per Day" visual, the slope of the decline after the July peak appears to be fairly sharp in comparison to previous reports.
4.2 All Available Data
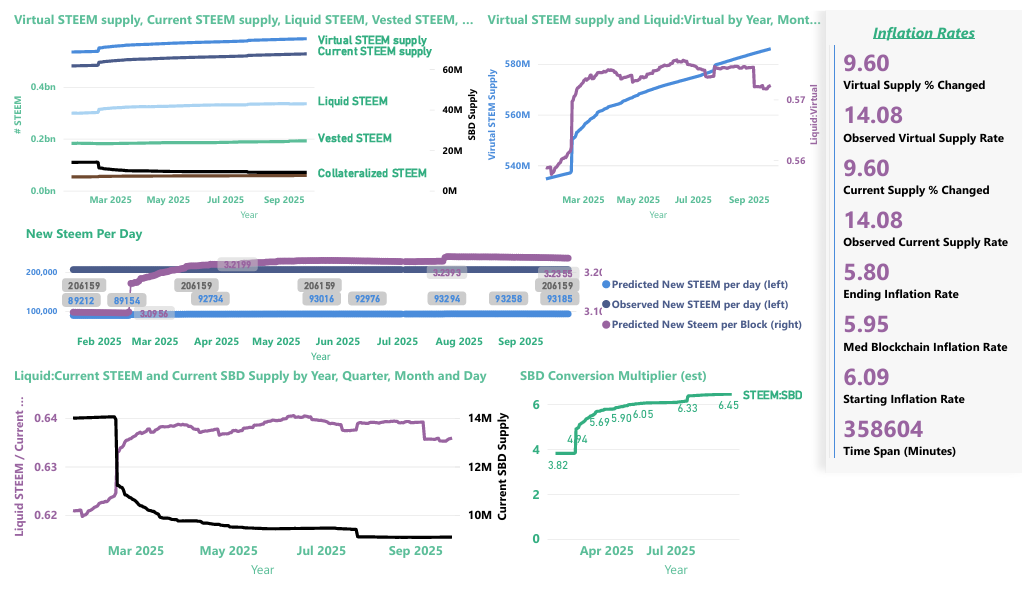
As in Q2, everything else is dwarfed by the SBD conversion activity in Q1. The blockchain inflation rate ranged from 5.80% to 6.09% with a median of 5.95%. The observed rate was 14.08%, again owing to SBD conversion activity and the corresponding rise in STEEM paid per SBD conversion, which increased from 3.82 to 6.45 (the total number of SBDs declined from ~14 million to ~9.1 million, but it's worth noting that ~5.2 million SBDs [57%] are currently locked in the SPS, where they can't be cashed out [without a proposal and community support]).
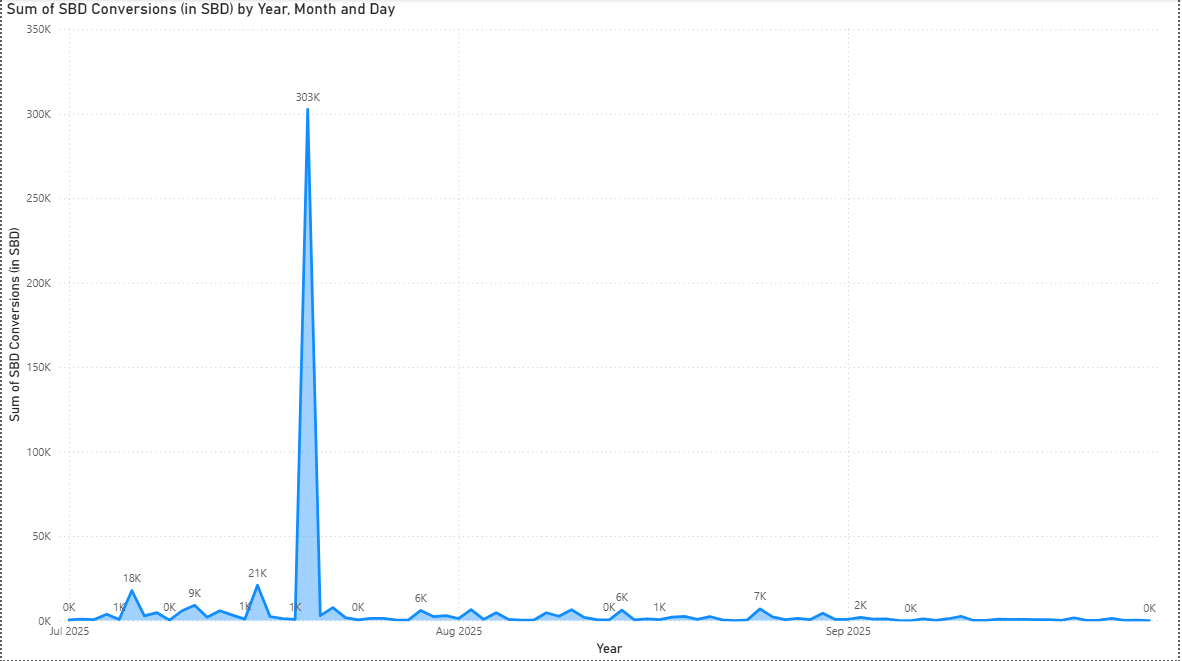
5. SBD Conversion activity
Based on this link, here is a visualization of SBD conversion activity during the last 90 days. It seems that the conversion activity has now lost most of its momentum. Barring surprises, it seems that we have moved past the last echoes of the Upbit SBD delisting(?).
Cautionary note
It's important to remember that these projections can all change, depending upon known and unknown factors. Known factors:
- Burning STEEM and/or SBD can reduce inflation
- If the STEEM price goes above the SBD print threshold, that will reduce inflation
- Witnesses can decide to start paying interest on SBDs, which could increase or decrease inflation - depending on the price of STEEM relative to the haircut threshold and on how/if interest payments influence SBD conversion behavior.
- If the STEEM price goes above the SBD print threshold, additional price movements can either increase or decrease inflation - depending upon direction of change.
- Missed blocks by witnesses can reduce inflation
- Witnesses can change any settings they choose in a hard fork, which could have any conceivable result.
- SBD conversions increase inflation when the price of STEEM is below the haircut threshold.
- There may be mistakes in these reports or other factors that I'm presently forgetting or not yet aware of.
Conclusion
In summary, it seems that Q3 probably caps off the last echoes of the Upbit SBD delisting in February. Inflation is returning to levels that are somewhat close to the blockchain's core rate, and the size of the existing supply of liquid SBDs seems unlikely to drive large jumps in the foreseeable future. 57% of all SBDs are locked in the Steem Proposal System, where they are very unlikely to be converted.
In the 3 quarters of 2025, virtual supply growth pushed the expected decline in daily STEEM production back by about 31/2 years. However, a new local peak was reached on July 26, and barring new surprises we would expect that to be the high-water mark for many decades into the future.
Thank you for your attention!
You can view an overview of my active projects, here