Topdown Analysis Of BTCUSDT Using Support And Resistance Strategy
Hello great minds,
It is a great opportunity to appear before you all today to share my analysis on bitcoin.
I believe you are all doing perfectly fine and are enjoying your activities in the community as you actively share in steemit promotion across various social media platform.
Bitcoin as we know it, is the father of all other cryptocurrency and it is worth carrying an analysis on, since it is the driver of all other cryptocurrency in the cryptospace.
Today, I will sharing my analysis of btcusdt and I will be beginning from the monthly timeframe.
ANALYSIS USING SUPPORT AND RESISTANCE STRATEGY
My analysis often begin from the higher timeframe and it moves to the lower timeframe.
On the higher timeframe like the monthly timeframe, I identify market trends, and on other timeframe I search for key market levels and also search for entries into the market.
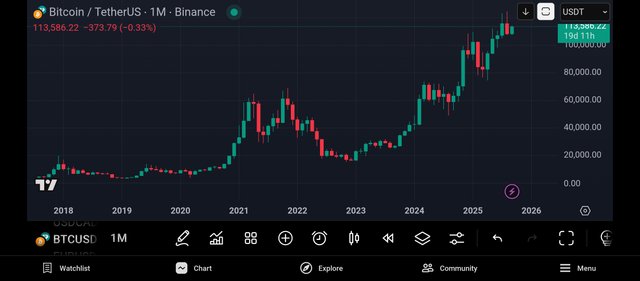
The above screenshot is that of btcusdt on the monthly timeframe as we can all confirm.
And from the above screenshot, we can see that there are less candles on this timeframe, and this is because each candle formed on this timeframe takes an activity period of one month.
Also on this timeframe, we can notice that the market trend is easily identified, and from the screenshot above, we can see that Bitcoin market is bullish overall.
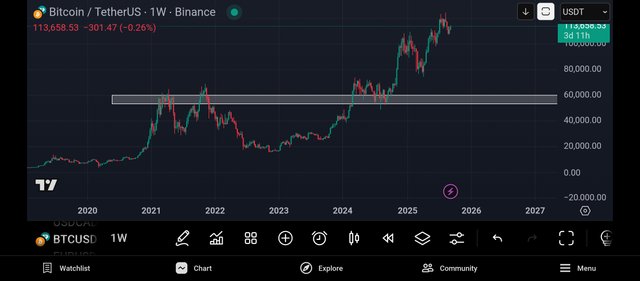
I then continued my analysis by moving to the weekly timeframe, and on this timeframe, I could see that formation of several candles, as each candle is being formed within the trading period of 7days.
And looking carefully, I was able to identify a key level, and this level is functioning as a support level to the price chart, and the market is expected to be rejected whenever it trades towards this level.
And from the above screenshot, we can see the validity of this level as it formerly functioned as a strong resistance level to the price chart.
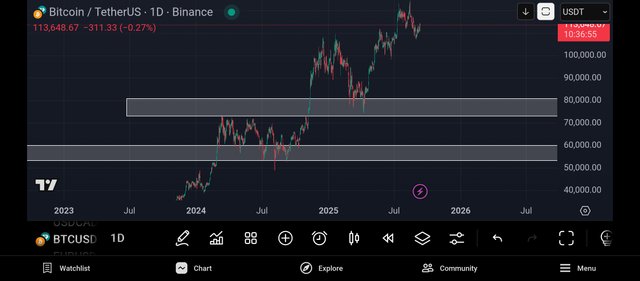
I then continued my analysis by moving to the daily timeframe, and on this timeframe, I could see the formation of several bullish and bearish candles in the market which indicated the presence of buyers and sellers.
And looking carefully, I was able to identify another key level and this level will be functioning as a support level to the price chart.
And from the above screenshot, we can see the market make several touches on this level.
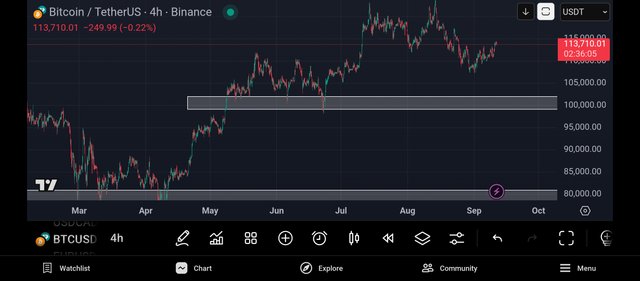
And moving to the 4hr timeframe, I could see lots of noise in the market, I could feel the presence of the buyers and sellers as they struggle to drive the market to their preferred direction.
And looking carefully, I noticed that the bears are in control of the market as it kept forming lower highs and lower lows, and also we can see it has retested its support level.
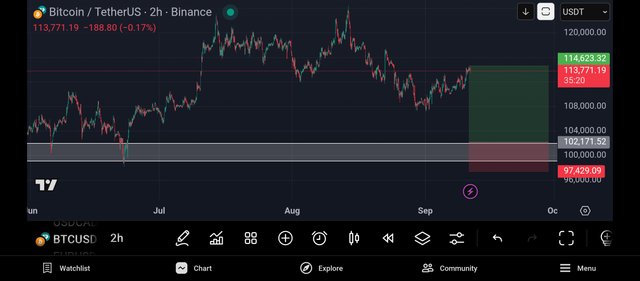
And as such, I decided to move to the 2hr timeframe in search of an entry into the market.
I then continued my analysis by moving to the 2hr timeframe, as I could see the market was just rejected from a support level, I expect it to retest this level before I take my trade again.
Greetings, friend @jueco
I think you've chosen the wrong community.
Thank you brother @adeljose.