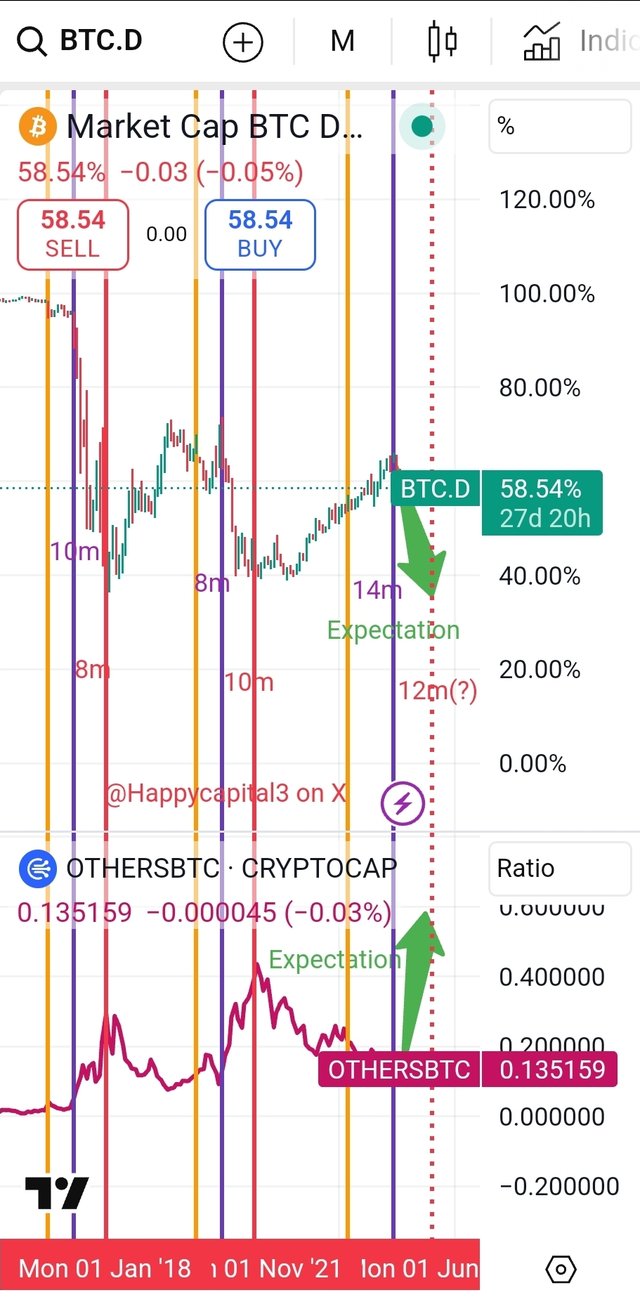
I was interested of OTHERS/ETH monthly candlestick chart.
I found OTHERS/BTC chart while I was looking for OTHERS/ETH chart. It's really hard for me to look for the OTHERS/ETH chart.
Anyways, I analyzed correlation between altseasons and the chart.
Altseason 1.0 ended in Jan 2018.
Altseason 1.0 ended with H&S(Head&Shoulder) pattern.
Since BTC(Bitcoin) dominance started collapsing, altseason 1.0 ended 8 months later.
Altseason 2.0 ended in Nov 2021.
Altseason 2.0 ended with Double Top pattern.
Since BTC dominance started collapsing, altseason 2.0 ended 10 months later.
I remember that I was financially comfortable during the altseason 2.0. It was a long-lasting utility season.
I think altseason 3.0 already started since this July. Because BTC dominance started collapsing since then.
If each altseason last longer and longer like 8 months, 10 months... after BTC dominance started collapsing, 12 months later of this July will be next July. Because, the tendency shows the 2 months gap.
So, I guess it will likely be the Double Top pattern rather than H&S pattern.
Someone will likely mock it doesn't make sense that altseasons won't last for a long time. I agree somewhat.
But we're about to encounter rate cuts this year, furthermore, expected rates next year will be much lower than at the end of this year.
Additionally, the results whether spot crypto ETFs are approved by the U.S. SEC will release this Q4. If most of them release, the liquidity will flow into the altcoin market. But it may take a long time like ETH(Ethereum), which means it could be a long-lasting utility season.
If this scenario occurs, I will sell in tranches (TP1, TP2, ... TP10, TP11 ...) amid getting LP(Liquidity Provision) and staking rewards. If it is successful, I might exit somewhat for the altseason 3.0.
