BNB Got Hypped! It's Skyrockting Noooooooooooooow!

Assalamu Alaikum,
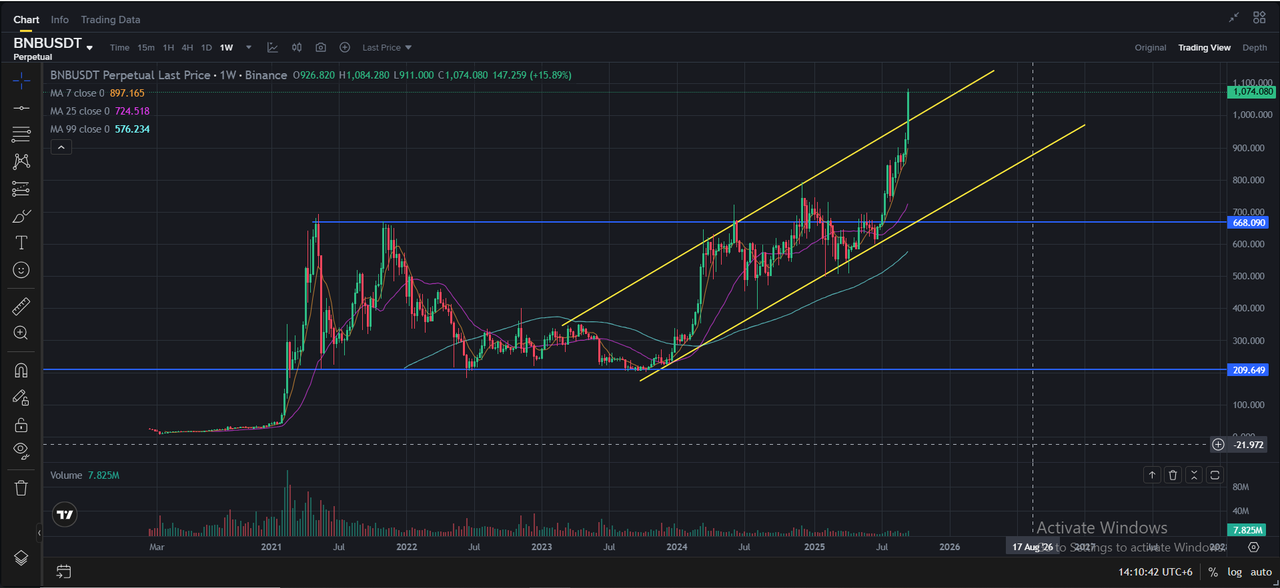
For those of you who are into the cryptocurrency world, this BNB/USDT chart is very important. This screenshot highlights the long-term performance of BNB and gives some hints about its future movement.
Looking at the chart, it can be seen that BNB has been following a certain pattern since 2021. First, a big rise, then it was trading in a range between $200 and $700 for a long time. This period was quite stable, which is a kind of testing time for investors.
However, the picture started to change from the end of 2023. BNB broke its old resistance level and started to rise and formed a new upward trendline, which is marked by two parallel lines in yellow. These lines indicate a new upward channel.
Currently, BNB is performing quite well within this channel. This shows that the bullish or upward momentum is still strong. However, it is difficult to say how long this channel will last. If BNB can hold this channel and move towards the top of the channel, we could soon see it make new highs.
On the other hand, if it breaks below the channel and breaks its main support line, which is marked with a blue line, the price could decline slightly.
We can clearly see one thing from this chart: BNB’s long-term trend is up. This chart is a ray of hope for those who are thinking of investing for the long term. However, it is always important to remember that the cryptocurrency market is very risky. Therefore, it is essential to do your own research before making any investment.
VOTE @bangla.witness as witness

OR

Thanks
