TIB: Today I Bought (and Sold) - An Investors Journal #311 - Amazon, US Banks, Altcoins
Markets took a breather. Earnings reactions are strong - Amazon gets smashed. AK Steel even worse in after hours. I am sticking my toe in the water.

Portfolio News
Market Selloff
US markets took a breather from the start of trade based on earnings and closed up for the day.

Earnings is currently driving the markets with analysts carefully looking at earnings and more importantly revenues. The surprises and guidance on revenues is really driving the sentiment. AK Steel (AKS) gets whopped 12% in after hours market. So much for steel tariffs coming to their rescue. The business was clearly in much worse trouble than tariffs could save.
Quite a few surprising moves up in my portfolios, Saudi Arabia (5.5%), Indonesia (3.4%), Greece (2.2%), Italy (1.8%).
The talking heads on CNBC Money spent quite a bit of time covering longer term trend charts, especially on technology stocks. I will cover one here using the Technology Select Sector ETF (XLK). The chart shows that price pulled below the weekly uptrend line which has been running since mid 2016.

The technicals lean toward price pulling back to the underside of the trend line (blue arrow) and then falling back again (red arrow) and heading to support below. This break is key because it also coincides with a break of a horizontal level (right hand blue ray). Will this be different to the false break we saw in January 2018?
Now there is some caution in reading this chart. This ETF is market weighted and Apple (AAPL) is 21% of the ETF. Apple is nowhere near its trend line and Apple reports next week. If Apple earnings do not disappoint, I would not be surprised to see this as a false break.

Now one really needs to make the same chart for all the tech stocks one is holding. Any breaks down need to be reviewed - exit versus hold for the very long term. See my Amazon story below.
Europe Muddles on with no change in rates.

Mario Draghi said that data was a little disappointing but he could see signs of rising inflation. The Euro spiked. He is so boring and I fear he is going to be so wrong.
Bought
Amazon.com Inc (AMZN): US Retail. Amazon announced results with earnings appreciably higher than estimates but revenue only in line. The after market response was a swift 7% sell off in after hours trade. The accountant in me saw things somewhat differently as the earnings beat tells me that the business mix changes (Cloud Computing and Advertising) are driving significantly higher margins. Jim Cramer has been keen on Amazon and has suggested buying in whenever there are strong pullbacks. I added a few shares.
Having advised doing the technical comparison to weekly trend lines, here is the AMZN chart.

Price is well away from the June 2016 uptrend line. It has challenged the steeper short term one (not shown). I have run Fibonacci retracements all the way up this trend line. They all turn at 0.38 or 0.50 and none has gone as far 0.618. My first nibble trade (1 share in each of 2 portfolios) is predicated on that 0.50 retracement level holding. If it does break lower, I will look again to see if it wants to go to 0.786. This is a long term trade based on the way Amazon is disrupting its industries, not just retail.
A bit of a back story here. In 1999, we sold our consulting business, Mitchell Madison Group, to a web development business, US Web/CKS. That pushed us full square into the growth of the internet industry. On the back of that, in June 2000 I bought 200 shares of Amazon for $38.03 a share. I sold them after the Dot.com crash in September 2002 for $16.11 a share. It felt like a lucky escape. Today's price after the selloff is 43.9 times higher - a hold would have worked a whole better (over $300,000 better).
In January 2008, I receieved a class action payout of $0.14 a share - they had misled the markets. I bought and sold 50 shares in late 2011 and 2012 for profits but did not recover all my losses. Maybe this time around - pity I can only buy a few shares.
Income Trades
One new covered call written today.
Wells Fargo & Company (WFC): US Bank. Sold November 2018 strike 54 calls for 0.74% premium (1.97% to purchase price). Closing price $84.70 (lower than last month). Price needs to move another 4.5% to reach the sold strike (tighter than last month). Should price pass the sold strike I book a 141% capital gain. Income to date amounts to 19.5% of purchase cost.
That 19.5% income reminds me why I keep doing this.
Cryptocurency
Bitcoin (BTCUSD): Price range for the day was $61 (0.9% of the high). It is not often that price moves in such a narrow parallel band for so long.

This is going to need some news catalyst to break, maybe the Bakkt event or an ETF anouncement.
Ethereum (ETHUSD): Price range for the day was only $2.

Price does not want to move away from $200. Blue arrow goes through the closing price highs. Nothing is going to happen on the upside until we see a challenge past this downtrend line.
CryptoBots
Outsourced Bot No closed trades. (221 closed trades). Problem children stayed at 18 coins. (>10% down) - ETH (-70%), ZEC (-63%), DASH (-68%), LTC (-52%), BTS (-52%), ICX (-78%), ADA (-71%), PPT (-80%), DGD (-80%), GAS (-83%), SNT (-60%), STRAT (-69%), NEO (-81%), ETC (-58%), QTUM (-75%), BTG (-72%), XMR (-39%), OMG (-68%).
Not a lot of movement mostly down by 1 or 2 points. ETH (-70%), PPT (-80%), and SNT (-60%) all dropped a level. GAS (-83%) remains the worst coin.
Profit Trailer Bot No closed trades.
Dollar Cost Average (DCA) list swells to 2 with ICX joining ETC. I think I have switched DCA off and am using PT Defender to do the DCA work (but I am not sure I have pressed all the right buttons). Time is short.

Pending list remains at 7 coins with 0 coins improving, 4 coins trading flat and 3 worse.


PT Defender continues defending 5 coins with no trade action. I have opened up trading to allow one more pair to clear the logjam. Thinking is to close out ETC trade and take the losses.
New Trading Bot Trading out using Crypto Prophecy. New trades opened on XEM after the early manual close the day before and NANO.

Trade entry was a few bars too early and price target landed up above where Bollinger Bands took shape - remember Bollinger Bands are a moving feast. Patient trader would have waited a few bars and then captured the full run from band to band.
NANO trade looks better on entry and then price went into a period of choppiness which also pulls the top bands in. Target price pulled back to the top band.

Forex Robot did not close any trades and is trading at a negative equity level of 24.4% (lower than prior day's 28.1%).
Outsourced MAM account Actions to Wealth closed out 1 trade for 0.34% losses for the day.
Cautions: This is not financial advice. You need to consider your own financial position and take your own advice before you follow any of my ideas
Images: I own the rights to use and edit the Buy Sell image. News headlines come from Google Search. All other images are created using my various trading and charting platforms. They are all my own work
Tickers: I monitor my portfolios using Yahoo Finance. The ticker symbols used are Yahoo Finance tickers
Charts: http://mymark.mx/TradingView - this is a free charting package. I have a Pro subscription to get access to real time forex prices
Crypto Prophecy provides a useful tool to identify oversold and overbought coins - https://mymark.mx/CryptoProphecy
October 25, 2018
It is very clear to see now that INflation is slowing, The fed still wants to hike?, and teh GDP is slowing on a rate of change basis. That is not good for markets and why we are getting killed right now
It really depends on which view one takes
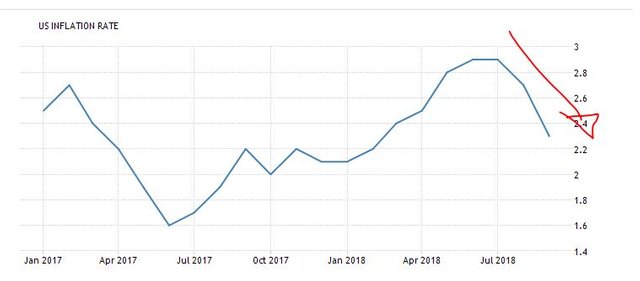
A short term view
Or a longer view
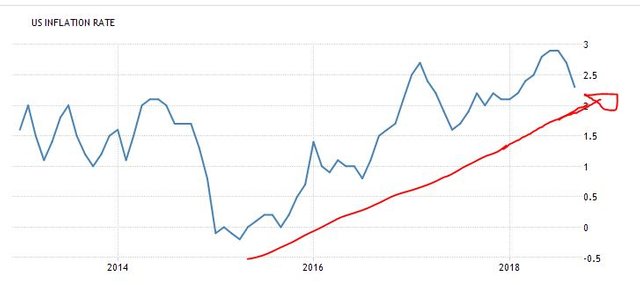
I know which one the Fed is looking at. This is the commentary on the latest data
Annual inflation in the US fell to 2.3 percent in September of 2018 from 2.7 percent in August and below market expectations of 2.4 percent. It is the lowest inflation rate since February, mainly due to a sharp slowdown in gas prices and smaller increases in fuel and shelter costs.
If the oil price forecasts on the back of Iran sanctions are right, we will see the gas price effect come out of the data and we go back to trend = rising inflation.
https://tradingeconomics.com/united-states/inflation-cpi
The battle will continue as the market concerns of the future of the economy given interest rates and trade wars have a "tug of war" with earnings as they continue to be pretty strong YoY. However, given that earnings are backward looking I could understand why we are seeing a pullback until the future direction of indicators are more clear.
We really do need to see specific and substantive progress on the China trade negotiations. The rest of the data is clear enough to see.
@carrinm, As an Crypto Enthusiast and Full Time Steemian waiting to see the Bull Run and hope that we can see in near future. And we all know that the market of Altcoins will be pushed by the price of Bitcoin due to dominance. And yes, most of the people are waiting for the ETF or i can say more than ETF, Bakkt is in line. Let's see how the path of Crypto Sphere will be in coming days.
Wishing you an great day and stay blessed. 🙂