Turning Points: Dow, SLV, GLD
Dow Analysis And Strategy
From the March 13, 2020 pre-opening report:
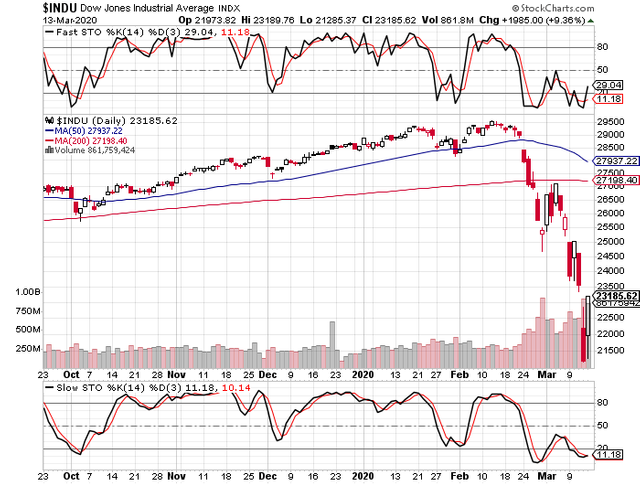
“Considering the above, and considering the facts that one can infer from the 6-month Dow chart below, those who are short via the put combination for the 2nd time this year, should close it out and take profits if the Dow were to cross above 22,500 on an hourly close basis.
“The insanity of the day suggests being wary of anything, and such trading as what is contemplated in the paragraph above would actually create a stochastic buy signal. For those who are operating a properly engineered put combination income and protection hedge program, there is too much profit to lose by being sanguine or greedy.”
Including the observation about the VIX level (it came within ~12 of reaching the 2008 peak at 90), a 2nd sizeable profit of the year should have been realized at the close on Friday, based on the 2-paragraph excerpt above.
Again referring to the excerpt, the Dow stochastic DID in fact create a buy signal by the close, which will be confirmed with a crossing above the 20-level (this is basis the SLOW stochastic, which appears beneath the Dow’s 6-month price chart, below).
As an aside, for those glued to headline news, make no mistake about it: the ~1550-point rally in the Dow’s last ~30 minutes of trade was related to expiring options.
Silver (SLV) an Gold analysis and strategy:
From the March 13, 2020 pre-opening report:
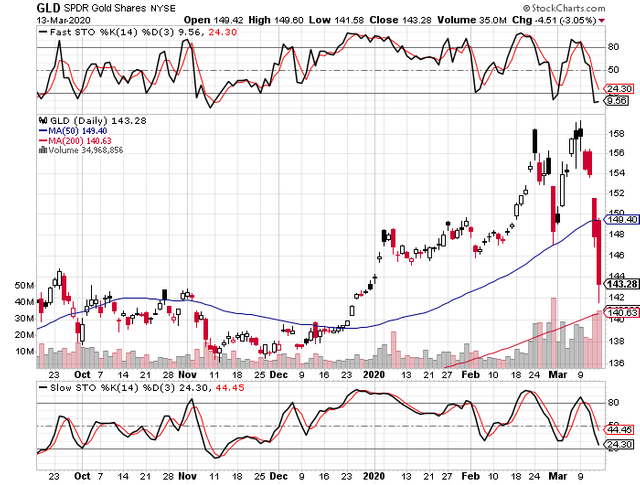
“Further, there is potential of 145 and 142 to the downside. However, the quick smash to the 148 – 150 area has been seen (see 1-year
GLD chart below) and there are 2 points that I ALWAYS bear in mind.
“Firstly, when gold enters a big bull phase like this, it deceptively corrects within an uptrend and, secondly, for the latter reason, the corrections conclude with sharp spikes down, thereby giving the impression to weak holders that a correction is beginning, as opposed to actually concluding.
“If one used the March report to sell gold, one can buy in thirds at 148, 145 and 142, basis the GLD.”
Based on the above, one should be long the GLD at an average price of 145.
Based on the 6-month GLD chart immediately below, the stochastic should be oversold or turned up by Wednesday. GOLD HAS CORRECTED WITHIN AN UPTREND, has fallen to major support (which is more optically pronounced on charts of longer duration than the one below), and has very quickly come unto its 200-day moving average.
MASSIVE support exists at ~137, so if one wished to first see if gold’s (basis the GLD) slow stochastic indeed becomes oversold and turns up before buying more, that’s fine, but for a long term holder, should one really care?
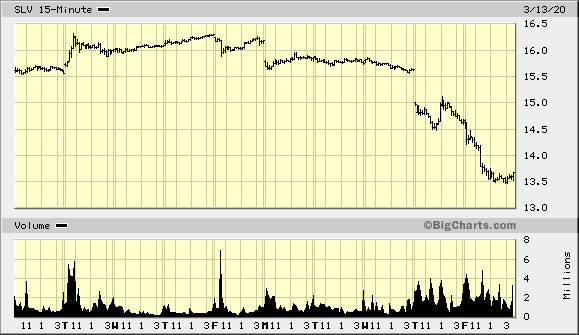
The 10-day SLV chart follows below.
A 5-wave decline is in evidence, which suggests that this metal’s ETF should see $14.5 – 15.5 through this coming week of the 16th.
From the March 13, 2020 pre-opening report:
“Such a strategy mitigates the negative effects of paying too much as a result of high premiums, and also helps offset to some degree the negative effect stemming from a near term negative time cycle which bottoms in the May – June period.
“Buy the September 30 calls with a strike price of $18.5, and sell the June 30 calls with a strike price of $18.5 for a debit (price) of $0.20. The market for the spread at the close today (Thursday) was $0.18 - $0.24. Sellers would just be happy to see buy orders, so there’s no need to be too aggressive.
“With this year’s volatility and the gold:silver ratio having hit just under 100 for the 3rd time in 80 years, profits could be spectacular, if the post-time cycle low (May – June) again works….but hopefully this time with fire, since investors will seek to go where there’s a greater reason to believe in longer term value and safety; stocks are leaving a very bad taste in everyone’s mouths – especially the asset allocators and money managers.
“All investors should note: Do not let the price of $0.20 fool you. The SLV options market is extremely deep, so this is not a game for retailers only; ignore open interest.”
Given the second major shot down in silver in as many days, investors are, based on the above, long the above-recommended spread position at $0.20. Further, the closing bid-ask was 14 – 24, reflecting a $0.19 mid-point. To embellish, the SLV closed 22 cents off its low.
As regards yesterday’s comment about value investors such as Jimmy Rogers “cracking up” (with laughter), the SLV came within 8 cents of its May 2019 low. This is occurring with gold a mile from its lows, and inflation spiking with this virus thing (the stores are dealing with the type of line-ups and offering the price mark-ups experienced by scalpers at Beatles concerts ~50 years ago).
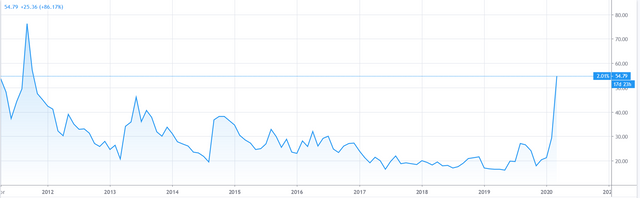
The VXSLV chart (SLV option volatility premiums) below dates back to its 2011 peak when the SLV hit just under $50.
The 2011 spike to its high is this chart’s next massive level, as one can plainly see below.
Longer-term holders of silver options are very likely going to enjoy one of the most profitable trades of their lives, and this should be the year when those massive profits start to be reaped by those who understood why they were being offered the prices of which they were taking advantage, and how fortunate they were to have stayed level-headed enough to alertly benefit.
Source
Copying/Pasting full or partial texts without adding anything original is frowned upon by the community. Repeated copy/paste posts could be considered spam. Spam is discouraged by the community and may result in the account being Blacklisted.
If you believe this comment is in error, please contact us in #disputes on Discord