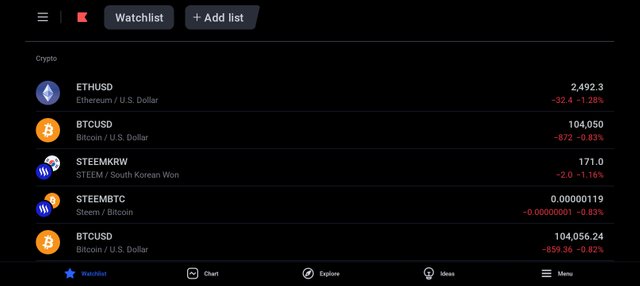
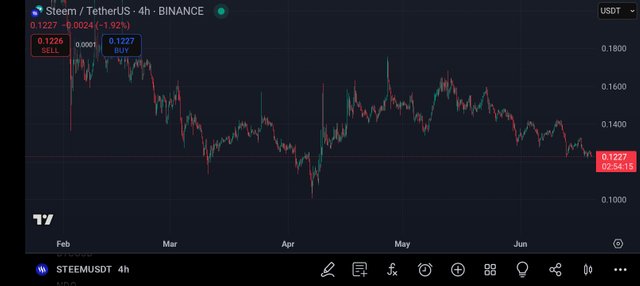
Crypto/technology
Hello, friends welcome to my post in which I have discussed "Writing Expedition ✍️, Have Fun while Writing! Choose From Varieties Of Topics" as part of my participation in this 👉contest.
To analyse the crypto market is very easy, but there are certain things that you need to understand before and after analysing the market, as it is not all about you knowing the difference between the bullish candlestick (green candle) and the bearish candlestick (red candle).
The thing is when analysing the crypto market and you want to get accurate results you will need to have an understanding of different tools and strategies from both fundamental and technical perspectives as the market largely depends on both technical and fundamental analysis: these two can be discussed on our next publication, but for not let's talk about how we can analyse the crypto market.
Understand Technical and Fundamental Analysis
Technical analysis: This is information that is obtained by using indicators, price charts, etc. When we are talking about indicators, we are simply referring to Relative strength index, moving average, Bollinger bands, and several other indicators to analyse the market. You can use an indicator to know when the market is overbought or oversold, the highest high and lowest low, etc.
Fundamental Analysis: This is information that is based on the real-world value of a crypto project or the entire crypto market. As a crypto trader, you need to be following business news, crypto, and news surrounding the financial markets to know what is happening. For example, if a prominent person like Trump or Elon Musk says something good about a certain cryptocurrency, you will see that the crypto will start rising as people start buying the crypto.
Watch Market Cap and Trading Volume
Trading volume and market capitalisation are very important when you're researching crypto to invest in. Price × Circulating Supply = Market Capitalisation. With this, you can know the size of a certain crypto, the 24-hour trading volume, etc. Remember, less supply means high value, more supply means lower value.
Use Charting Tools
There are a lot of charting tools that you can use to identify trends such as support and resistance levels. The question now is, how do I spot support and resistance levels? Support level is the level at the bottom of a chart that supports the price to move up, whereas the resistance level is the highest level at the top before the price starts dropping. This is just a layman's understanding.
To spot support and resistance levels, know price movements, etc, you will need to use charts from any of the following: TradingView, Coingecko, coinmarketcap, Binance, Mexc, etc.
For today's lesson, we should stop here and put into practice what we have learnt, if possible. For more enquiries or learning, drop your views, opinions, etc in the comments section of this post.


https://x.com/AkwajiAfen/status/1935746877510574316
🎉 Congratulations!
Your post has been manually upvoted by the SteemX Team! 🚀
SteemX is a modern, user-friendly and powerful platform built for the Steem ecosystem.
🔗 Visit us: www.steemx.org
✅ Support our work — Vote for our witness: bountyking5
Your content has been successfully curated by our team via @ ngoenyi.
Thank you for your valuable efforts! Keep posting high-quality content for a chance to receive more support from our curation team.
Thank you for publishing an article in the Steem Kids & Parent community today. We have assessed your entry and we present the result of our assessment below.
MODs Comment/Recommendation:
Thanks for sharing this crypto related post with us.
Remember to always share your post on Twitter. This POST LINK is a guide to that effect.