SOL/USDT Price Reaction Expected – Watch This Key Level!
🔹SOL/USDT (4H) – Technical Analysis
▪ Key Price Zones
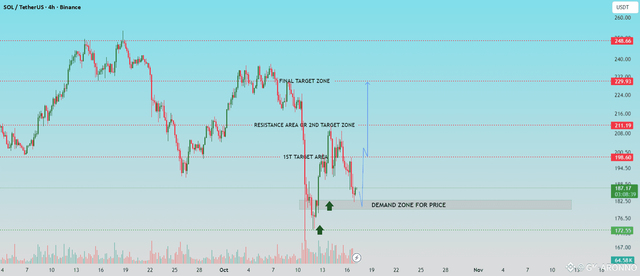
▫ Demand Zone: 182.5 – 176.5
SOL is currently trading inside a well-defined demand zone. Price has reacted positively to this level twice before (green arrows), suggesting buyer interest and possible accumulation.
▫1st Target Area: 198.60
This level has acted as a strong supply/resistance zone in the past and represents the first upside target if the price successfully bounces from the demand zone.
▫ 2nd Target Zone / Resistance Area: 211.19
A move beyond the first target could bring SOL into this resistance zone, which previously capped bullish momentum.
▫Final Target Zone: 229.93
This is the upper resistance area and final bullish target based on historical highs and market structure.
▪ Market Structure & Setup
Price recently dropped sharply into the demand zone but has begun to consolidate.
Volume spikes during the decline followed by stabilization indicate a potential short-term bottoming pattern.
The projected move (in blue) suggests a rebound from this demand zone with potential resistance at each target level.
▪Outlook:
▫ Bullish Scenario: If demand holds and price confirms a reversal (e.g., bullish engulfing, breakout candle), expect a move toward 198.60, followed by 211.19 and possibly 229.93.
▫ Bearish Scenario: A sustained break below 176.5 may invalidate the bullish thesis and open downside toward the next support (not shown, likely around 172.55 or lower).
▪Conclusion:
SOL/USDT is at a critical support level. A bullish reaction here could set the stage for a multi-leg recovery. However, confirmation is key before entering long positions.
Support Me For More Insightful Analysis.

Upvoted! Thank you for supporting witness @jswit.