$STEEM Price Analysis – Where Do We Go From Here?
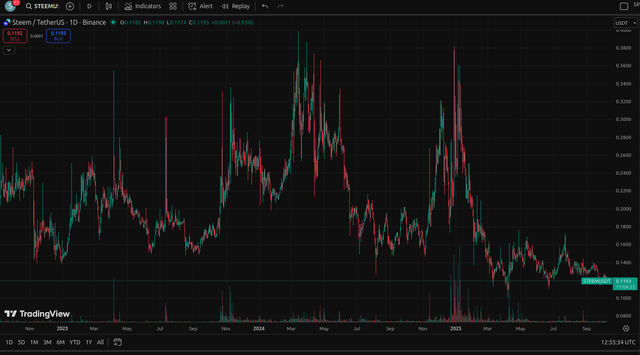
The $STEEM chart since November 2022 paints a story of repeated volatility followed by long periods of consolidation. After several notable peaks — including runs toward $0.35–$0.40 — the token has gradually retraced to its current level around $0.12.
Key Observations:
- Support Zone: The $0.11–$0.12 region has held multiple times since early 2023, forming a strong base. As long as this zone remains intact, the downside risk appears limited.
- Resistance Levels: Short-term resistance sits at $0.15, followed by a heavier barrier near $0.18–$0.20. A breakout above that could open room toward $0.25+, which would mark a shift in market sentiment.
- Trend: The overall trend since mid-2024 has been downward, but momentum indicators (on daily timeframes) are showing signs of flattening — suggesting possible accumulation.
- Volume: Trading activity has been decreasing gradually since the last major spike in early 2025, which may indicate that sellers are running out of steam.
What’s Next?
For now, $STEEM sits at a crucial pivot point. A bounce from the current range could set the stage for a recovery rally, but failure to hold the $0.11 line might invite a retest of the psychological $0.10 support.
Given the historical cycles visible on this chart, $STEEM has often rallied sharply after long periods of sideways action — but patience is key. Traders may want to watch for a confirmed breakout above $0.15 with increasing volume as the first bullish signal.
📊 Current Price: ~$0.119
🕒 Trend Bias: Neutral to slightly bullish (if $0.11 holds)
⚠️ Invalidation: Daily close below $0.11
Steem’s long-term fundamentals remain community-driven, and any renewed engagement or ecosystem updates could trigger fresh upside momentum.

!thumbup
Hello @thevpnboss! You are Superlative!
command: !thumbup is powered by witness @justyy and his contributions are: https://steemyy.com
More commands are coming!