Using a combination of analytic probabilities to establish a favorable outcome in the market.
I going to put together a number of tools I have researched that have proved positive results in trading over the time I have spent practicing the forex, stock, energy, indices and crypto markets respectively.
So I have found that these asset classes move differently but also occasionally react the same to some world events don't get me wrong similarly but not identically .
Nothing's safe from the effects of the economy and the government.
I have also found that its curtail to fallow the rules but this is easier said then done, at some point you have to realize whatever you believe in this world is up to you.
Subsequently I have decided to make a list of all the tools that may be helpful to profitability problem, while considering the fact that I need to keep it simple but then also logical at the same time practicing how to avoid jumping into things just because the setup is volatile.
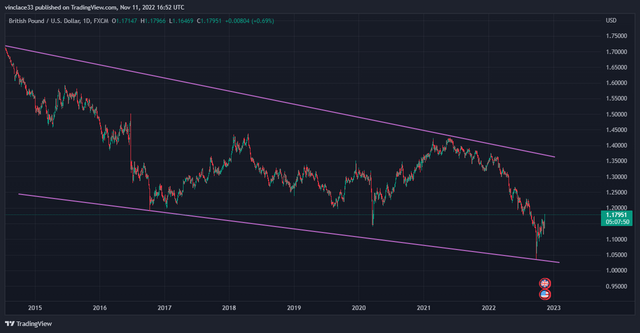
Ex: A I have found that the 4H time frame is a little more clear but more expensive as per the stop placement. using the Great British pound v.s the Us Dollar this is
Using the trend line tool shows me a downward movement based on the past few months.
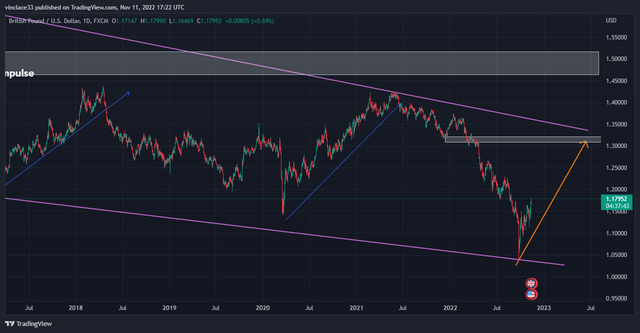
The arrows are to differentiate between the impulse and correction faze in the pair so this here is where you have to make the decision which will serve to be more profit able to you. from my studies following the trend is curtail:
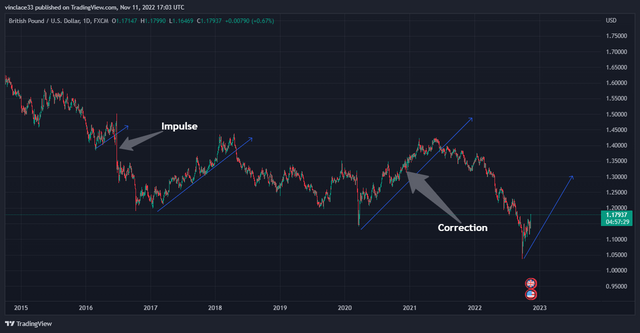
I wish to be a professional and I believe the first thing you have to do is know why you are purchasing this asset at this point and also not to be to attached to the trade practicing proper risk management.
It may look like we are on an up word trajectory but initially on a long term biased I believe its logical to be looking for sell orders especially when we reach peaks or break that yellow arrow line we may have strong continuations to the downside. In the short term it looks like price may move up to the levels of 1.30000 but with the strength of the sellers in this pair is bliss.
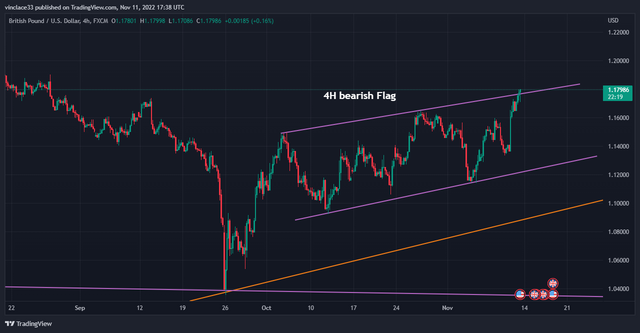
We are currently experiencing a bearish flag breaking out to the upside this is not based on research on market candle stick formations. From my personal point of view this looks like a liquidity grab before we continue to the downside. Looks to much like a fake out to me.
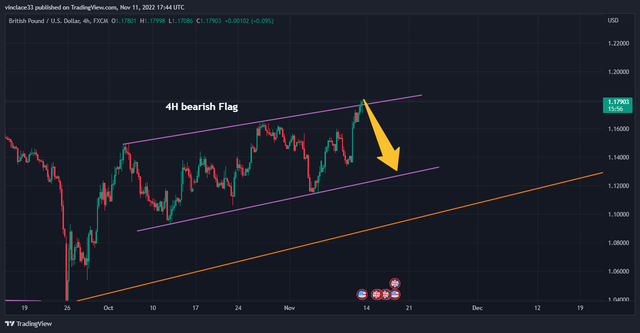
Now that I know our direction I need an entry and I need to know how much I am willing to spend on this trade and if I am willing to hold it where is my target and how much am I expecting to gain.
NB! One thing is for sure I do not know how far its willing to go up before it then decides to turn back so I have a few options to help with this problem.
- Placing a buy stop order in the opposite direction of the sell order we are trying to take, until eventually perhaps we reach a level that seems as if we have reached a major level in the market close the buy order and then open one more entry to the downside or not depending on weather we still believe price is going to come back longer term and continue downward. Currently I believe it may be a better Idea not opening an extra entry on top as it can tend to still continue into the negative with your orders. New mini options: I open an order in both directions if it goes against my sell order I make money on my buy order on the resistance I close the order then place a stop loss just Above the resistance.
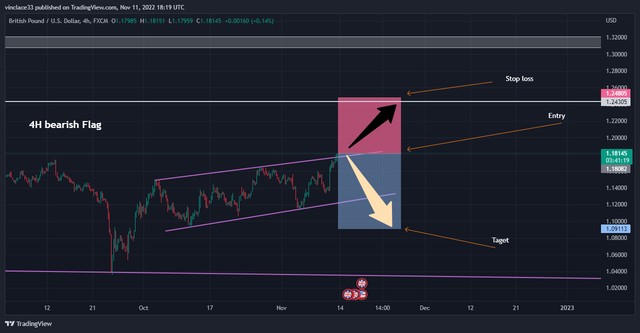
Taking this trade may turn out highly profitable but that risk to take there is an outrage.
So if hedging to the upside is out of the question we have one more option and that is going ould school Smaller time frame with a tight stop loss but the problem with this is that the longer term biased may serve to be irrelevant.
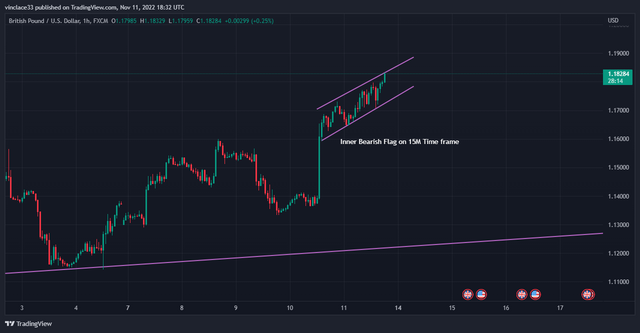
Now that we are on the lower time frame and the trend is on a strong push to the upside does it mean I change my directional biased and start buying short term or continue but then waiting for price to come to me for my new sell order?
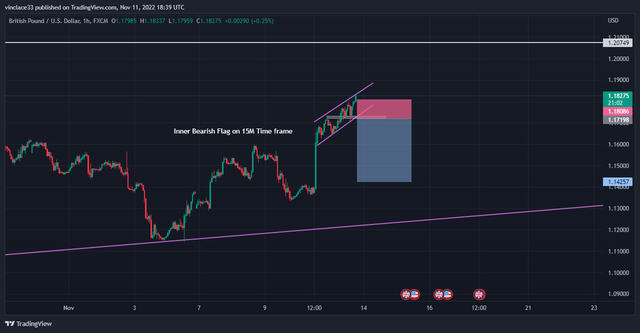
In this scenario it looks like its better waiting for price to come to you Rather then entering in random trades as you may be correct but the market may first give you some trouble before going in your direction or your favor.
If you would Like to practice trading the market with me I recommend following this link bellow lets make so money or be found died trying.
Trust me the last thing I want to do is to confuse you but going to the you can clearly see why I said this was a fake out but we still have to consider there may still be movement to the up side even though it may take some time due to obvious the downward pressure on the higher timeframes.
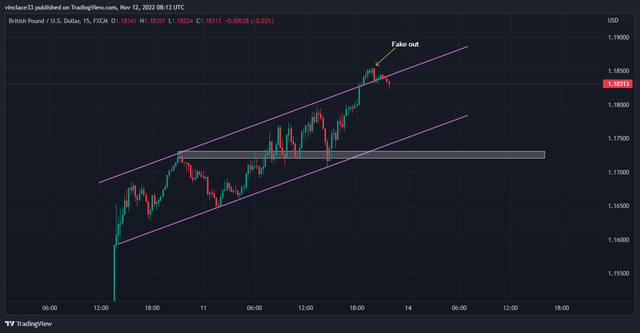
Now that we have broken back into the channel it may be logical to continue trying a more concentrated I was thinking going to an even smaller timeframe to see how that works out:
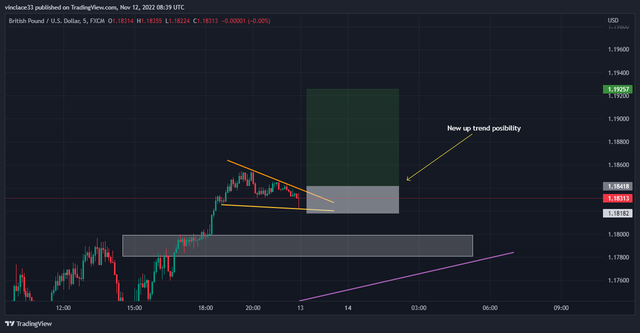
Now that we are using the smaller time frames it no longer makes any sense looking for opportunities for downside but opportunities for the short term upside.
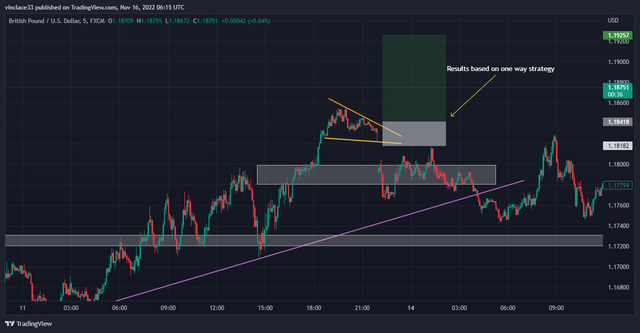
Eventually My first bias was correct but how do we avoid losing money when we where typically correct in the first place. I will have to try the both direction strategy but then this system needs a lot of maintenance and baby sitting. Word of mouth will not get me to far as they say repetition is the father of learning. Stay tuned as for the next post we are going to try solving this issue making sure we pay our moneys worth and not wasting any as we are on our way to make a mollion.
