Introduction
It's with great pleasure I'm attending the new week at the academy, and this time, I've attended the great lecture from professor
@kouba01. The professor lectured on
Cryptocurrency trading with RSI and I will solve the task given by the professor with this article.
What is the Relative Strength Index - RSI and How is it Calculated?
Relative Strength Index is a technical indicator used on cryptocurrency chart pattern to detect when the price behavior of an asset rises or falls tremendously beyond expectation. As such, this allow traders position themselves for a good or buy entry to take advantage of an extremely bullish or bearish of a cryptocurrency market.
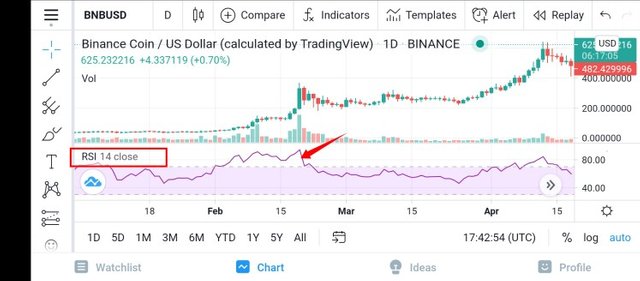
Relative Strength Index placed beneath the Price chart
This Relative strength indicator detects or tracks if an asset is overbought (that is, when demands of an asset exceeds supply) or oversold (that is, when supply of an asset exceeds supply) and this will enable cryptocurrency traders to make a good position for buy or sell and thereby expose them to massive profit from the market.
How Relative Strength Index is calculated
The Relative strength index can be calculated from the basic expression below;
RSI = 100 - 100 / (1 + RS)
Where RS from the expression above equals:
Average earnings over a high period over a given period / Average loss over a high period during this period

Can we trust the RSI on cryptocurrency trading and why?
Yes, Relative Strength Index justice/result can be trusted in cryptocurrency trading. Why? In my own view, for the indicator to have revealed an overbought or oversold (extreme position over a period of time), that means the price behaviour has been really bullish or bearish and such result is more precise than an indicator that shows a mere uptrend or downtrend.
Since Relative Strength Index make comparison between a bullish and bearish price behaviour in a cryptocurrecy market to have the result shown through the oscillator thereby revealing overbought and oversold of an asset over a period of time. Oversold and overbought in this context means an extreme sell/buy, and as such, makes the indicator a reliable technical indicator to place a good buy or sell. Some cautions should be put in place to be sure of the trend direction while using the RSI indicator, at least 3 bars after overbought or oversold was revealed and putting in place stop loss is also necessary to be on a safer side.
How do you configure the RSI indicator on the chart and what does the length parameter mean? Why is it equal to 14 by default? Can we change it? (Screen capture required)
The process of configuring the Relative Strength Index will be shown below and I'm going to use TradingView App to get it configured.
Steps
- I've registered an account on TradingView. (Note that: You can still use the TradingView without registering but your access would be limited in some cases)
- Open the TradingView App.
- Select chart at the bottom of the page.
- Click on indicators.
- Search for RSI in the search bar provided and click on one of the results (Relative Strength Index).
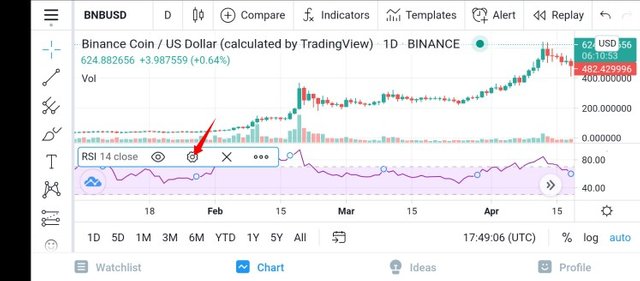
- Click on the RSI indicator beneath the price chart to explore more options.
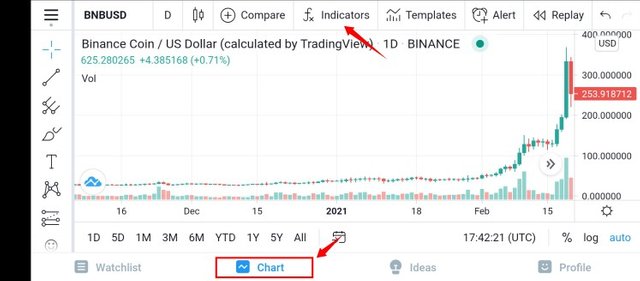
Chart >>> Indicators
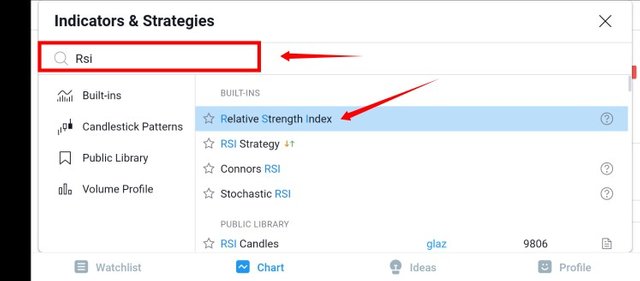
Search and Select- Relative Strength Index
Relative Strength Index placed beneath the Price chart
- Select the settings icon from the more options on the RSI indicator.
- Edit the preferences on Inputs and effect the settings by clicking OK.
- Edit the preferences on Style and effect the settings by clicking OK.
Settings on the RSI Indicator options
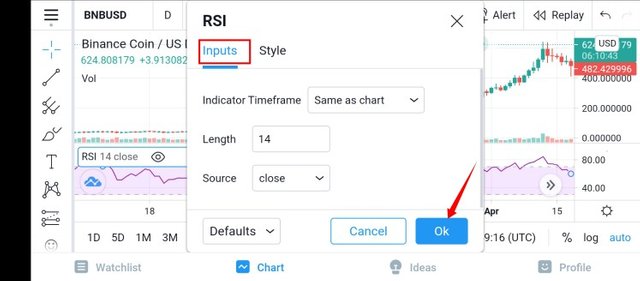
Inputs >>> OK
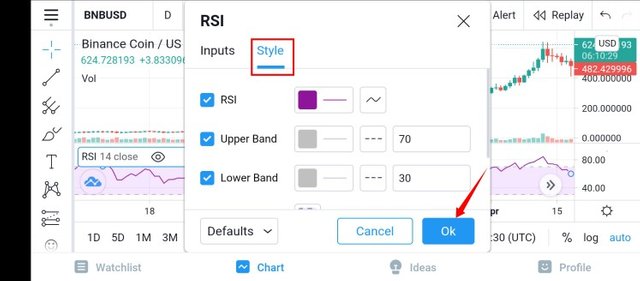
Style >>> OK
RSI configuration highlights- Inputs
Length: This can also be referred to as Period and it implies the number of bars that the indicator would analyze to give an average value over a period of time, and length is 14 at default.
Source: This is basically talking about the positions of the price behaviour, meaning the price an asset opens at or the peak the price attained or the lowest price reached, taken into account by RSI to give results when making comparison between bullish and bearish of an asset market to give the required result.
RSI configuration highlights- Style
Font: You can customize the colours you want on your RSI indicator base on your preference. Here, you can select the thickness, colours of the RSI lines and levels and it extend to the colour filling in between levels.
Upper and Lower limits: This is the limits of the RSI indicator which was set at default to be 70 for upper limit and 30 for lower limit. This implies that when the RSI readings is greater than 70 (> 70), it gives an overbought signal and when it is lower down 30 (< 30) which gives an oversold signal.
Length Parameter
As said earlier, length is the number of bars that would be analysed by the RSI indicator to give an average value. It is kept at 14 at default such that the price behaviour over the last 14 days is taken into account by the RSI indicator. The length parameter can be altered, meaning you can change it to a preferable value. I will give a screenshot of how to change it below.
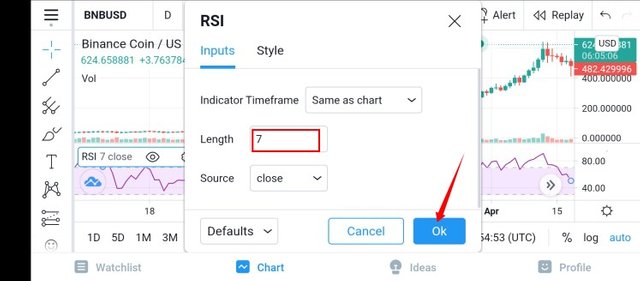
Length parameter- 7
From the screenshot above, I changed the length parameter to 7 which means the price behaviour of the asset over the last 7 days would be taken into account.
How do you interpret the overbought and oversold signals when trading cryptocurrencies? (Screen capture required)
An overbought signal is seen when the oscillator appears above the levels and oversold signal when the oscillator appears below the levels. At default, the upper limit is set to 70 such that anything above, that is overbought, and there is tendency of trend reversal (downtrend) at that point, opening a good position for sell, likewise, 30 is the lower limit at default whereby anything below 30 is an indication of oversold, also there is tendency of trend reversal (uptrend) opening a good position for buy. The screenshot below will show the overbought and oversold using the BNB/USD pair.
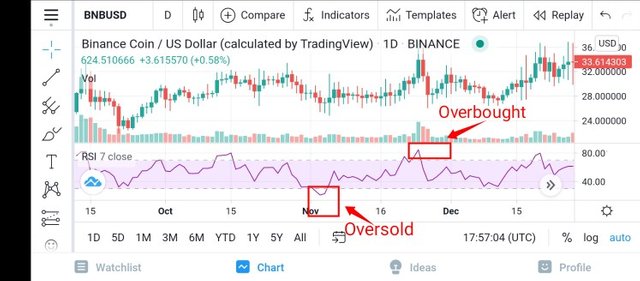
Overbought and Oversold
How do we filter RSI signals to distinguish and recognize true signals from false signals. (Screen capture required)
Like every other technical indicators, RSI indicator gives false signal which is noticed when the indicator enters the overbought zone and remains there for a longer period of time without trend reversal (bearish) also when RSI enters an oversold position and stays there for a longer period of time without a trend reversal (bullish). Typically, as a trader you should await confirmations of up to 3 bars to see if there is a trend reversal before concluding it's truly overbought or oversold.
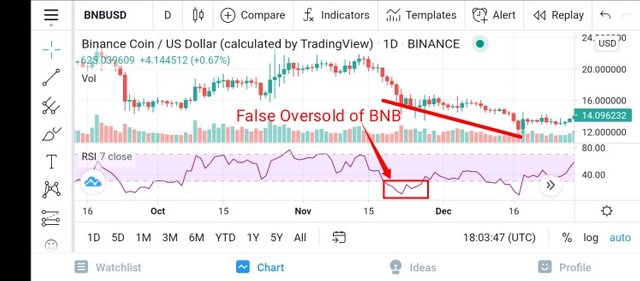
False Oversold
At a genuine oversold, there should be a trend reversal (bullish) but in the above as seen in the screenshot, the price continues to be bearish even after showing an overbought signal. This is a false oversold signal as the price behaviour continues to be bearish.
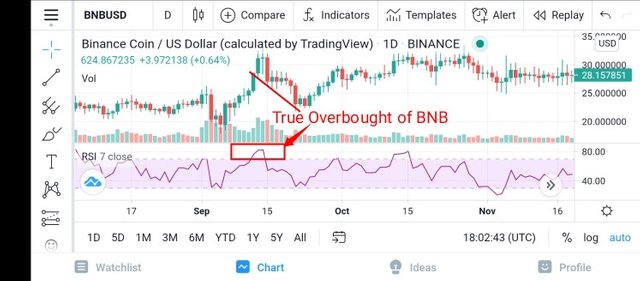
True Overbought
At a true overbought, the price behaviour of the asset should experience a trend reversal (bearish) and the case in the screenshot about is the same. At overbought, the price behaviour of the asset experienced a reversal (bearish) and that makes it true overbought.
Review the chart of any pair (eg TRX / USD) and present the various signals from the RSI. (Screen capture required)
For this section, I will be reviewing the price chart of BTC/USDT pair to show genuine overbought (that includes a good sell position) and oversold (that includes a good buy position).
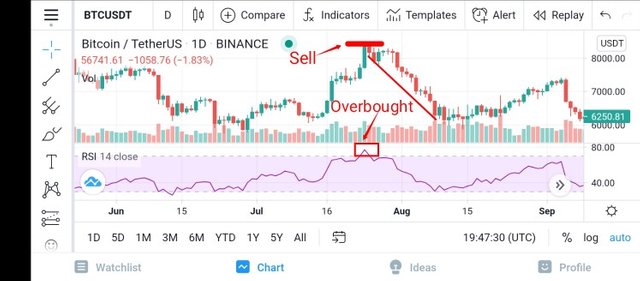
Overbought
The analysis above reveal the overbought of Bitcoin and it's a genuine one as there was a reversal trend (downtrend) which opened the position for sell, the RSI is above 70 and very close to 80. This action works in compliance with the genuine use of RSI indicator as Overbought should be followed by a downtrend reversal.
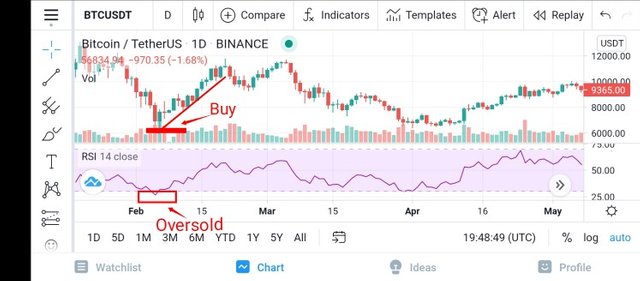
Oversold
From the screenshot above, the RSI is below 30 and nearly touches 25 which gave an Oversold signal, and was followed by a reversal trend (uptrend) which opened a good buy position. This also is a genuine one whereby oversold was accompanied by a buy which shows a consistent trend (uptrend reversal after oversold).
In conclusion, Relative Strength Index is with no doubt a great indicator which makes comparison between bullish and bearish in the crpyocurrency market to enable traders take advantage of the extreme bullish or bearish market yo maximize their profit. Thanks to professor
@kouba01 for this wonderful lecture. Thank you all.
Cc: @kouba01
Written by; @fredquantum


Hello @fredquantum,
Thank you for participating in the 4th Week Crypto Course in its second season and for your efforts to complete the suggested tasks, you deserve an 8/10 rating, according to the following scale:
My review :
Great effort to do this homework, and you have succeeded with most answers, but some details remain unreported, especially regarding the question:
I will not give the answer now until students have equal opportunities.
Thanks again for your effort, and we look forward to reading your next work.
Sincerely,@kouba01
Thanks for the review professor. I'm glad I participated and I look forward to seeing the revelation of the answer to the question you highlighted at the end of the week. Thank you one again.