crypto market
Yes exactly 👍
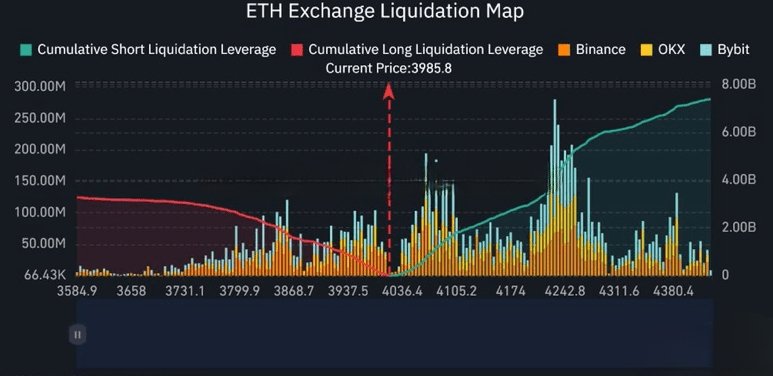
This is a crypto market liquidation map, which most traders use for technical analysis and to understand market direction.
In this chart:
Green line (Cumulative Short Liquidation Leverage): Shows how many short positions will be liquidated if ETH price goes up.
Red line (Cumulative Long Liquidation Leverage): Shows how many long positions will be liquidated if ETH price goes down.
Orange (Binance), Yellow (OKX), Blue (Bybit) bars: Represent the liquidation volumes on different exchanges.
Current Price: 3985.8 with a red dashed line indicates the current market price.
In simple words, this chart shows at which price levels the most liquidations (forced buy or sell) will be triggered if the market moves up or down.
Such articles and charts help traders understand the “pain points” in the market — meaning where big players’ stop-losses or liquidation levels are placed.