BTC 3-Day Bullish Divergence Confirms Today
Point and Figure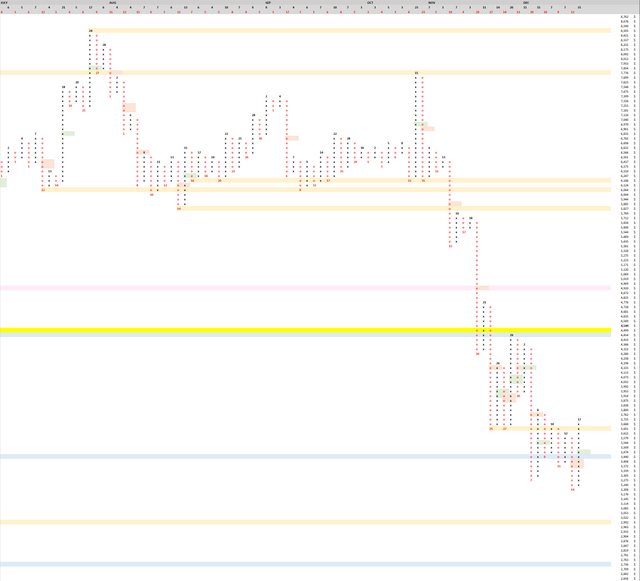
Here are the recent long pole of O's, from the big wedge breaking down, which have not resolved 50%: 10/31/2018: 23 O's, resolves if price moves above $6,901. 11/15/2018: 19 O's, resolves if price moves above $5,885. 11/20/2018: 29 O's, resolves if price moves above $4,920. It could be a while before we see all 3 resolved, but I would be cautious shorting until at least the third is resolved with a price move above $4,920.
Yesterday's daily closed gave us the same set up as on 12/08/18: A daily RSI bull div that could cascade into a 3-day RSI bull div. For those who played it the way I recommended on 12/08/18, great job. Sadly that wasn't me! So now I am in a bit of a pickle because we are coming up on a 3-day bull div confirming at today's close, but today was an insane +10.00%~ day, and I hate to buy following a big day like that.
In 2 hours we will confirm a bull div on the 3-day RSI.
 This is big news because it is the first sign of momentum slowing on the 3-day chart, which is the same chart we broke down from a large wedge on. This is a clear buy signal. Also there is good confluence with some lesser quality oversold indicators such as VIX FIX (green bars) and TD Sequential (green numbers).
TLDR: Best time to buy was yesterday's 1-day bull div close. For those of us who didn't, we'll need to watch lower timeframe and find an entry to play the 3-day bull div which confirms in 2 hours. 3-day timeframe is pointing towards relief for bulls.